CAP AND GOWN RENTALS DROP OFF RESUME ON MONDAY, JUNE 8
Seniors who rented a cap and gown may drop them off at the Business & Activities Office (C120). Diplomas may be picked up at the Counseling Office.

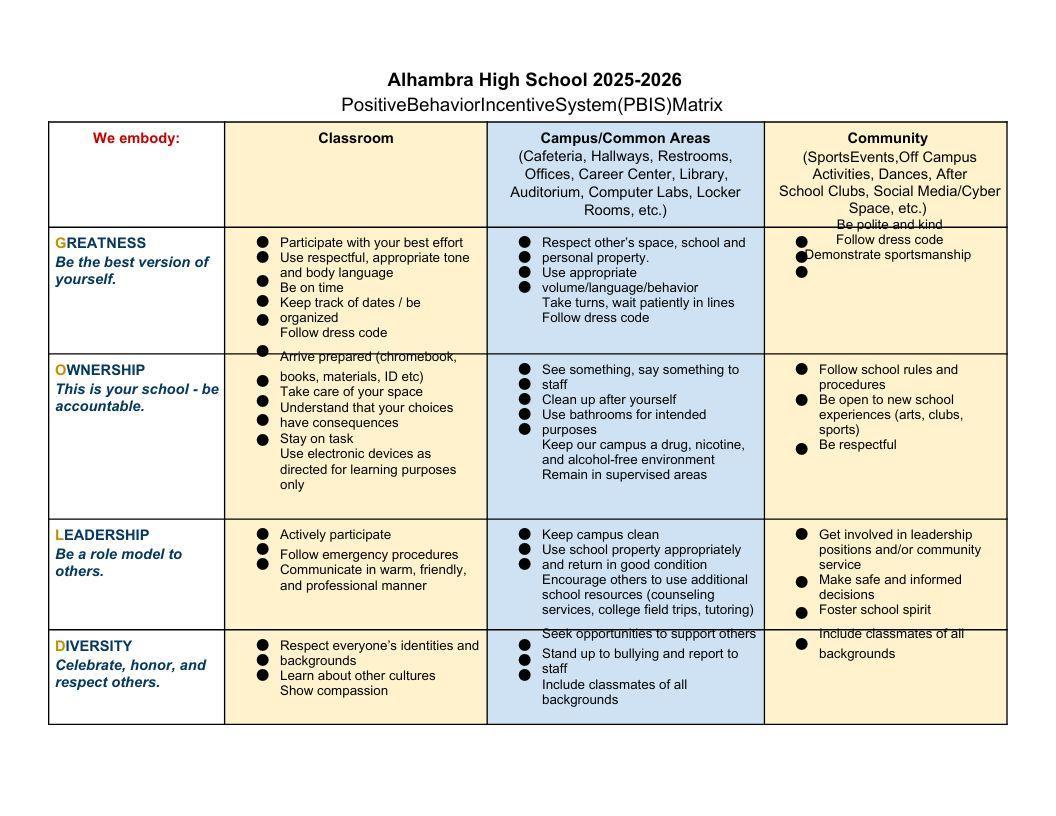
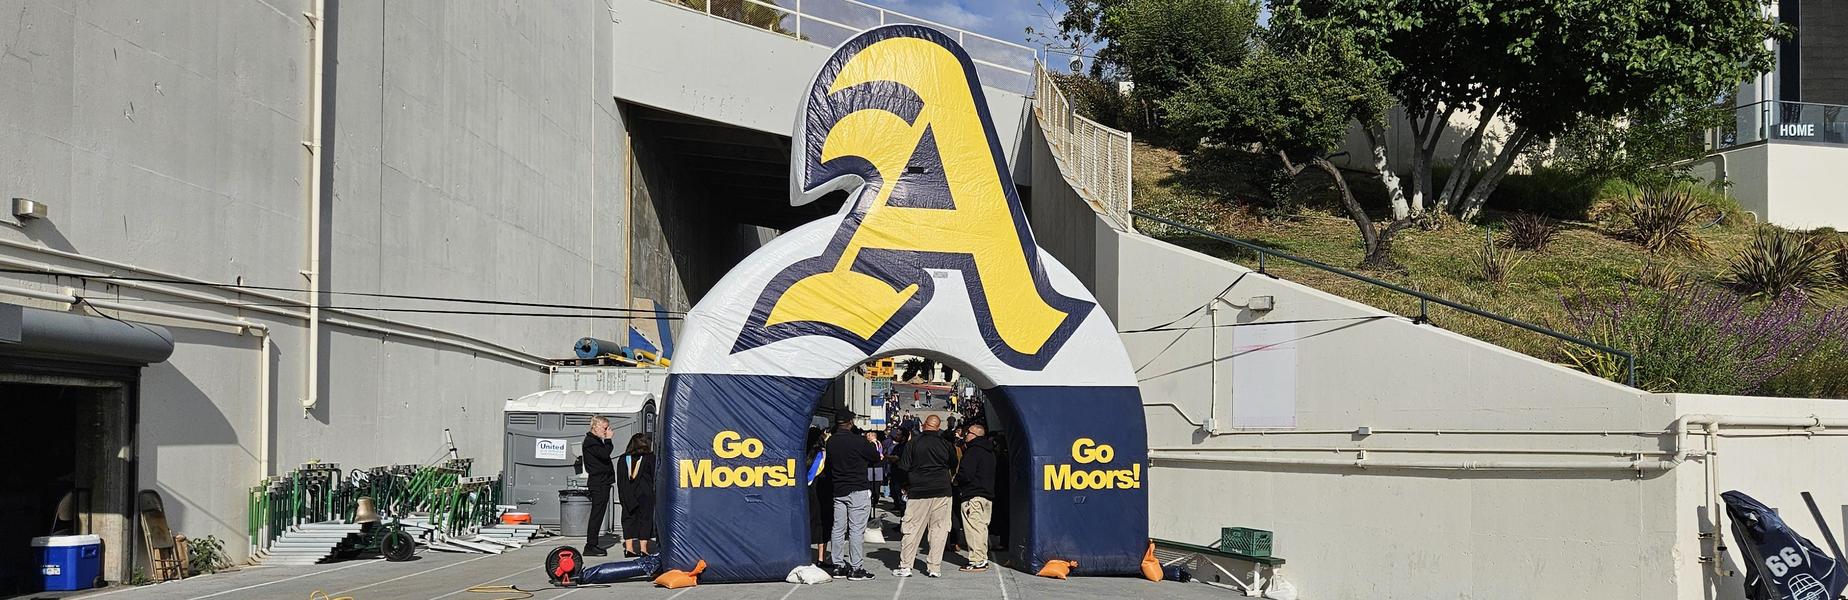
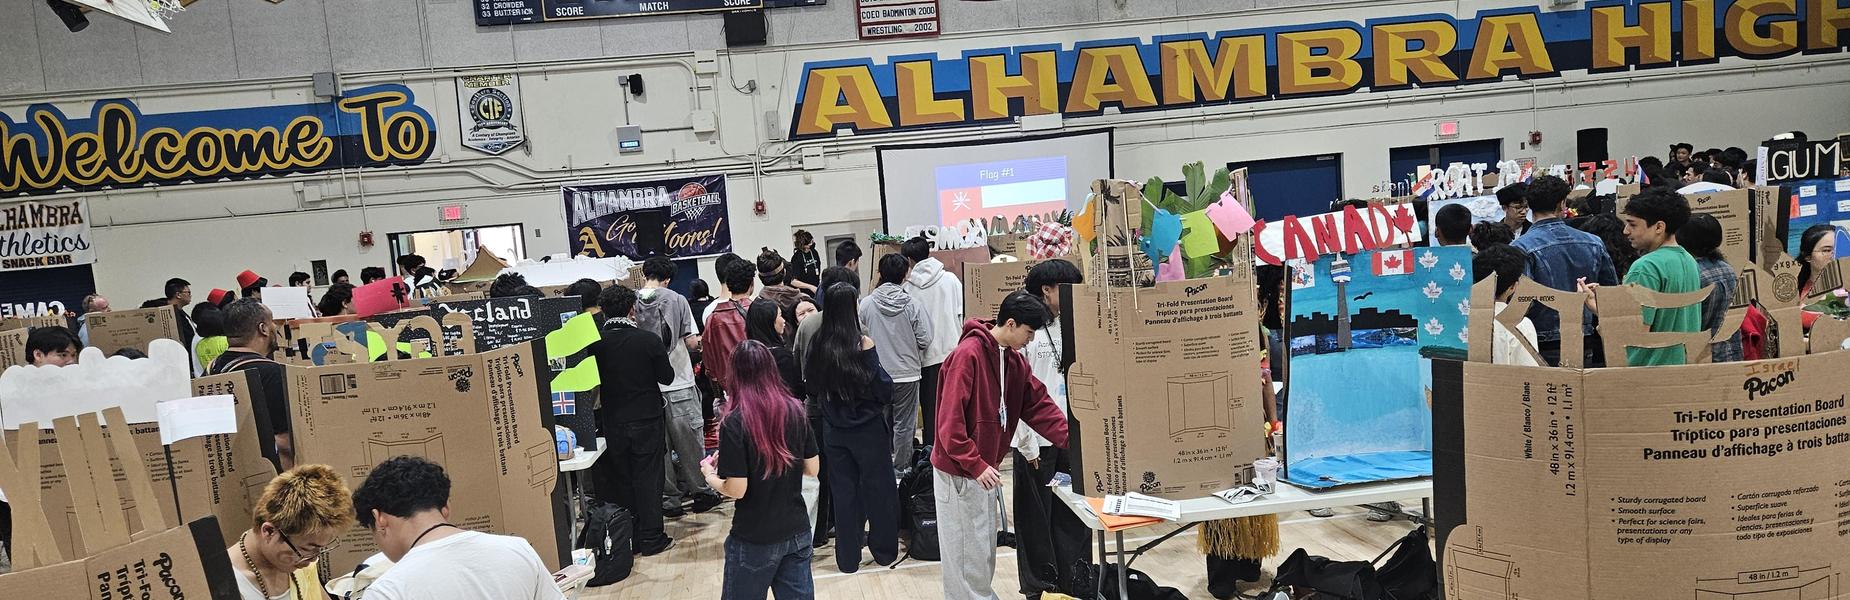
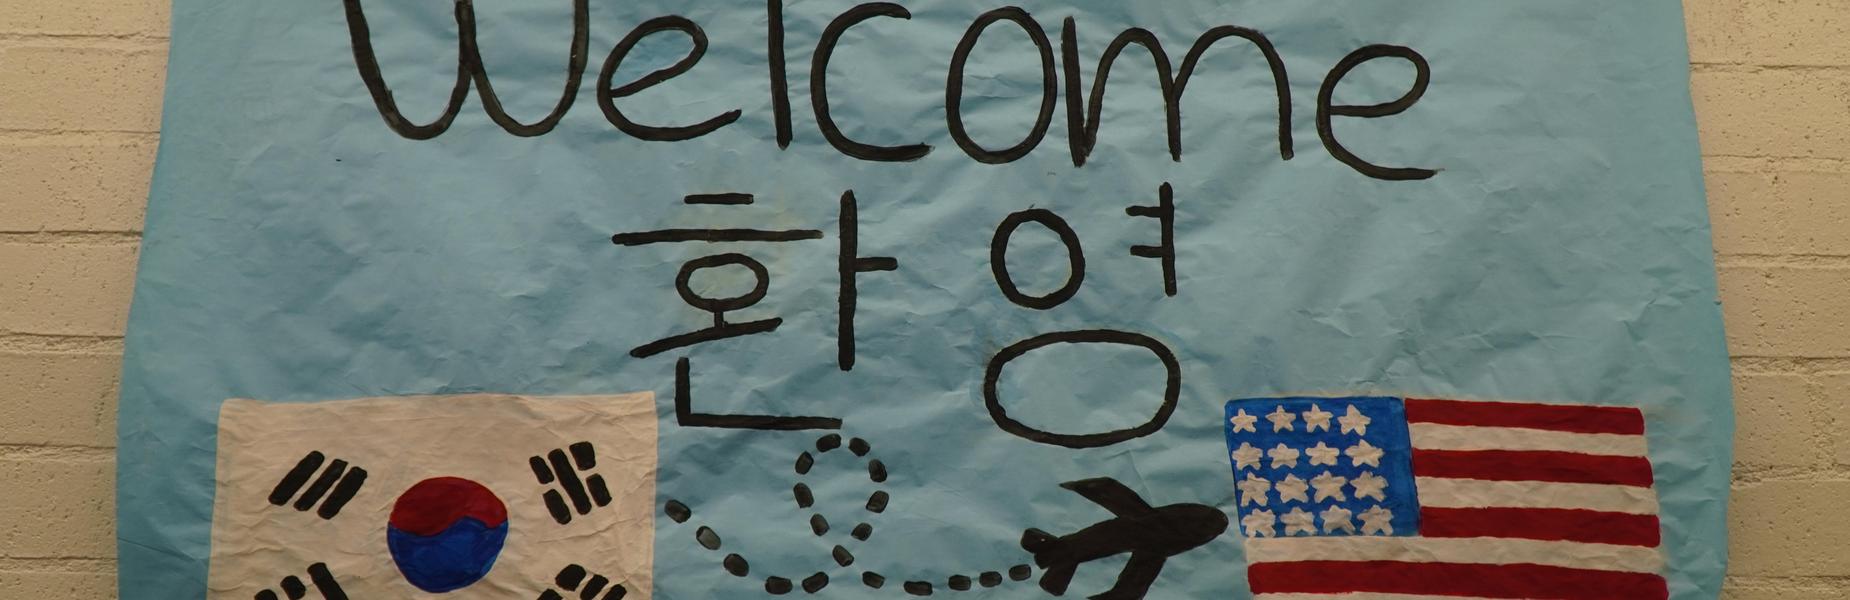
Welcome to Alhambra High!
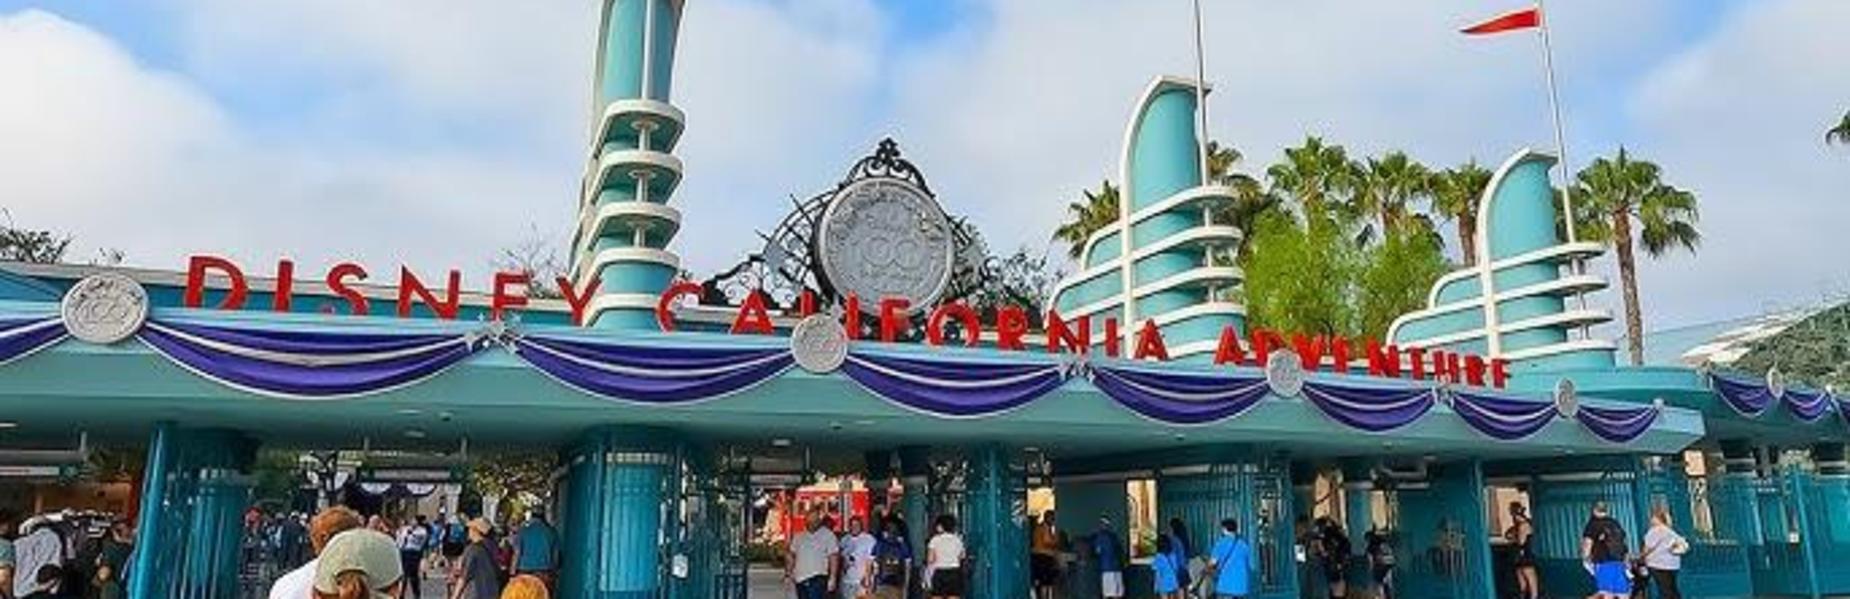
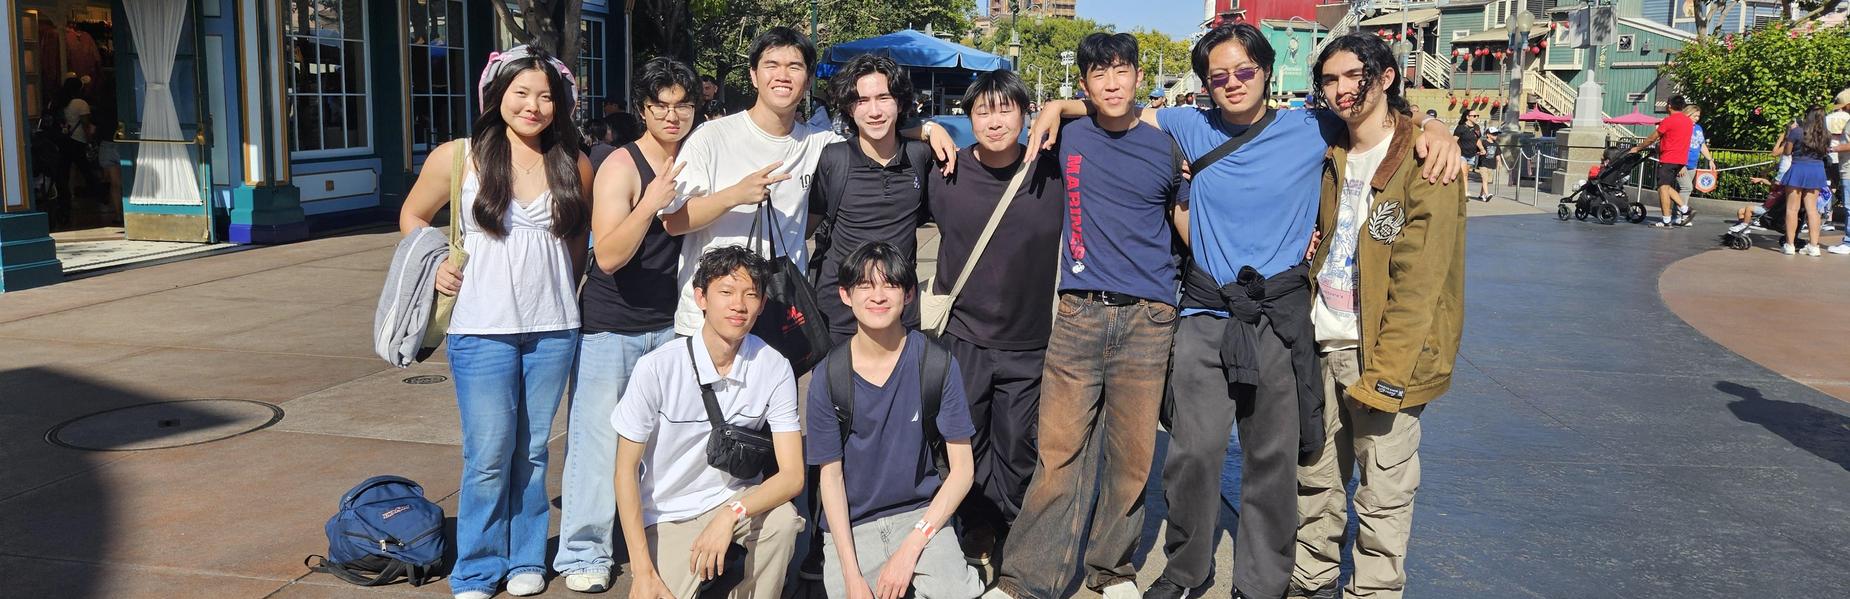
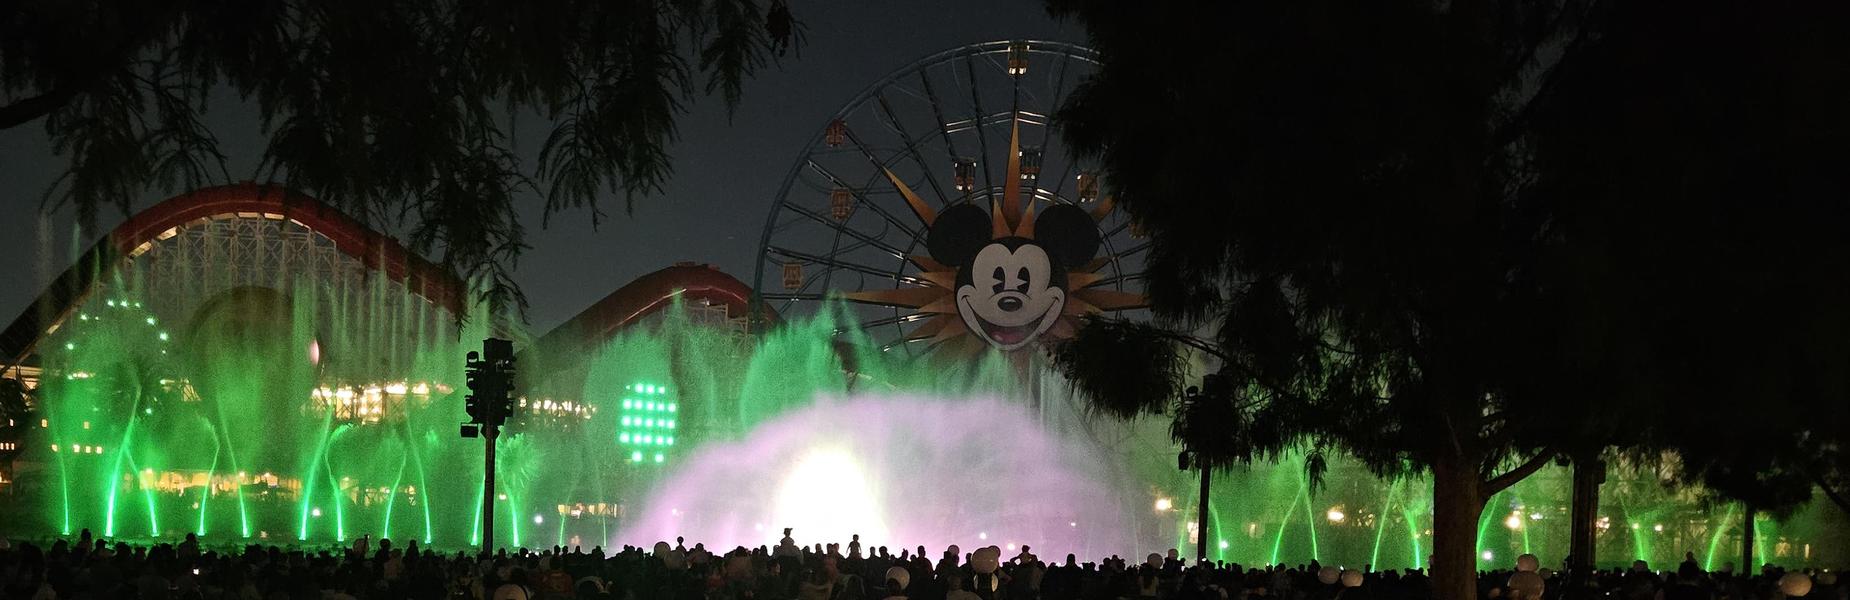
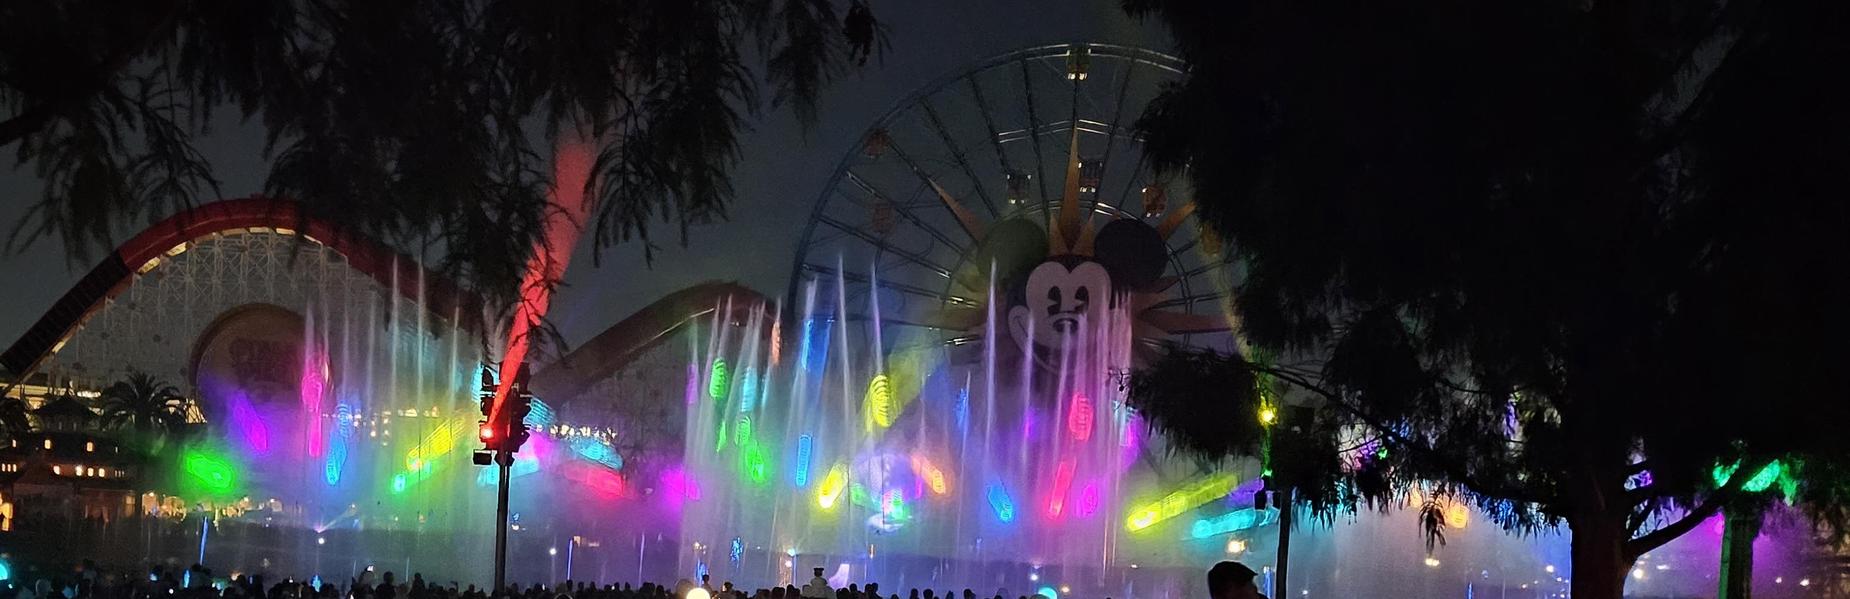
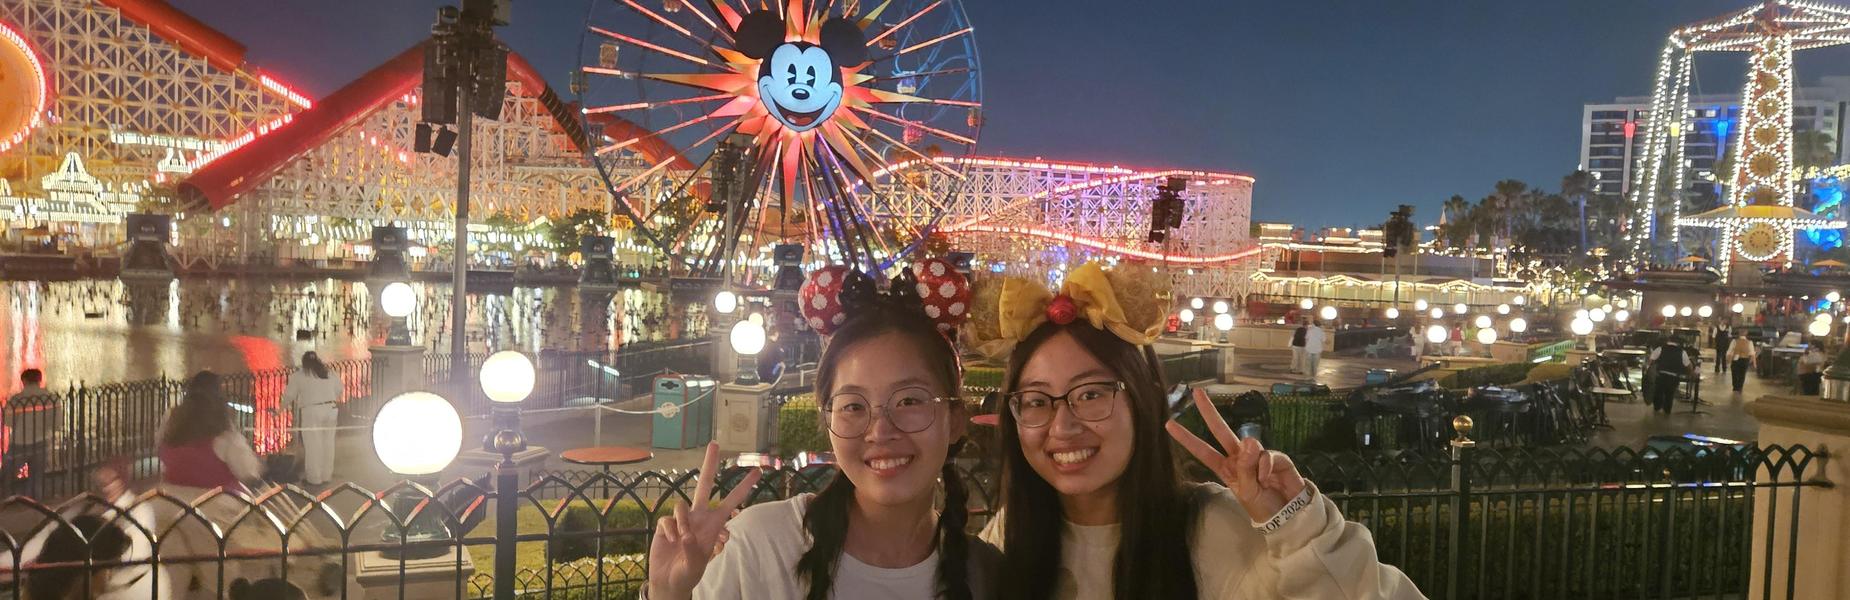
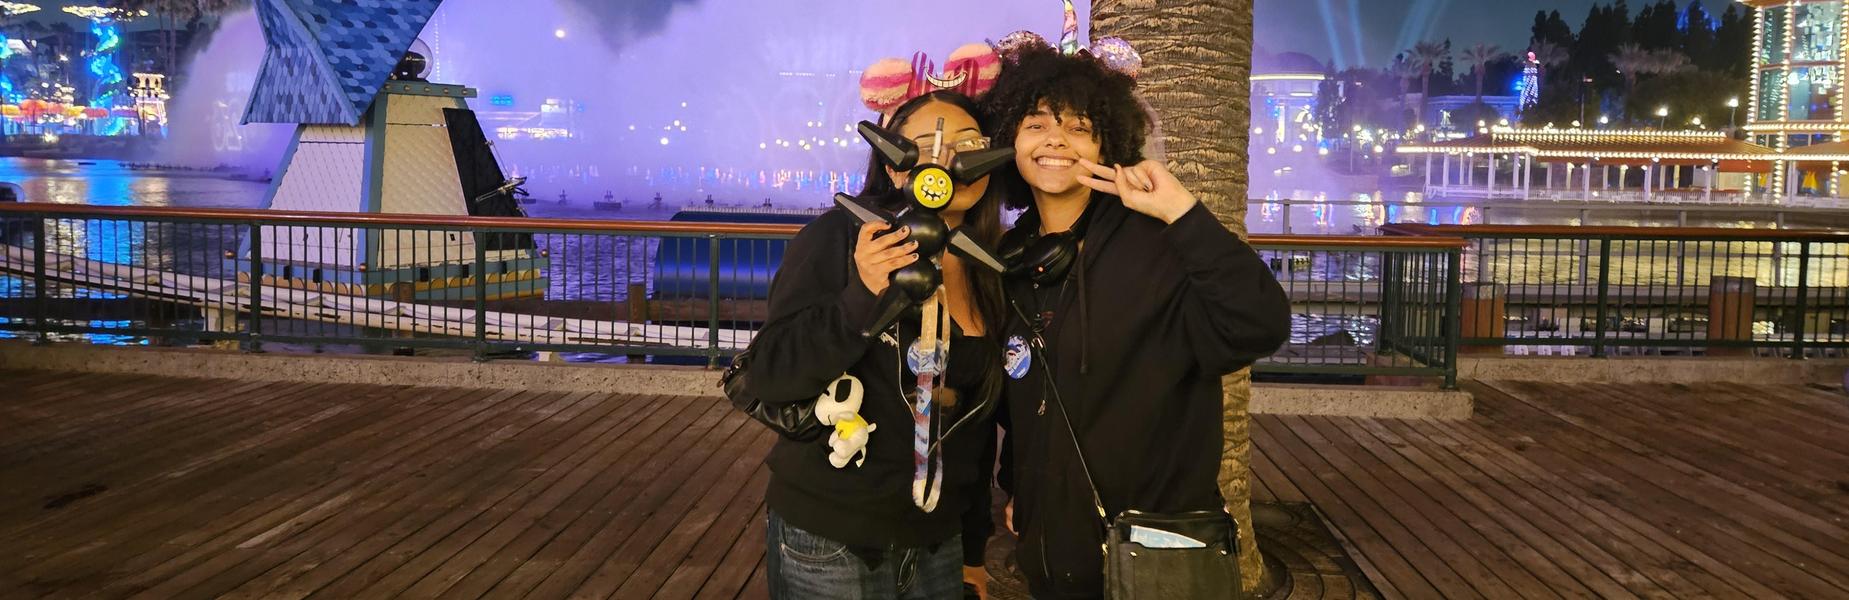
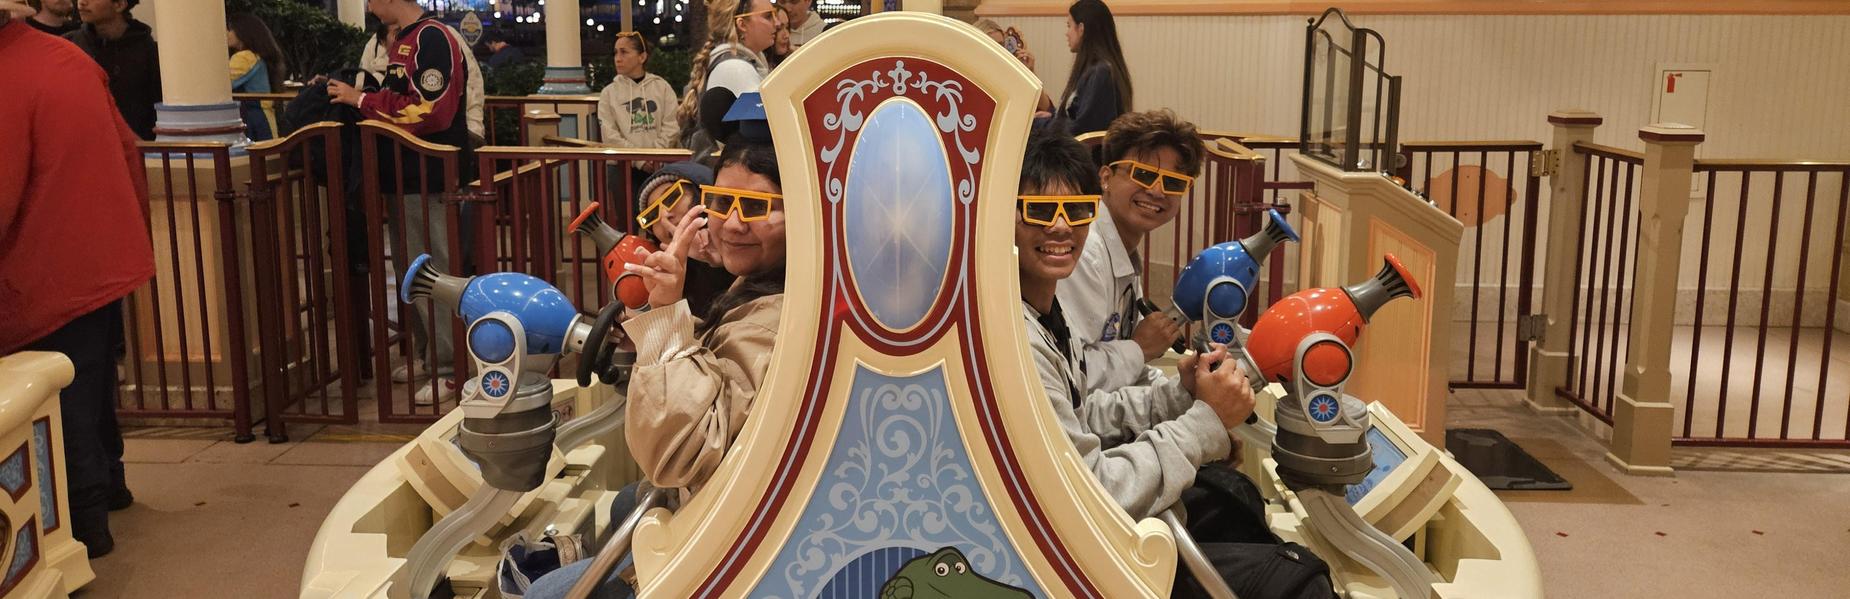
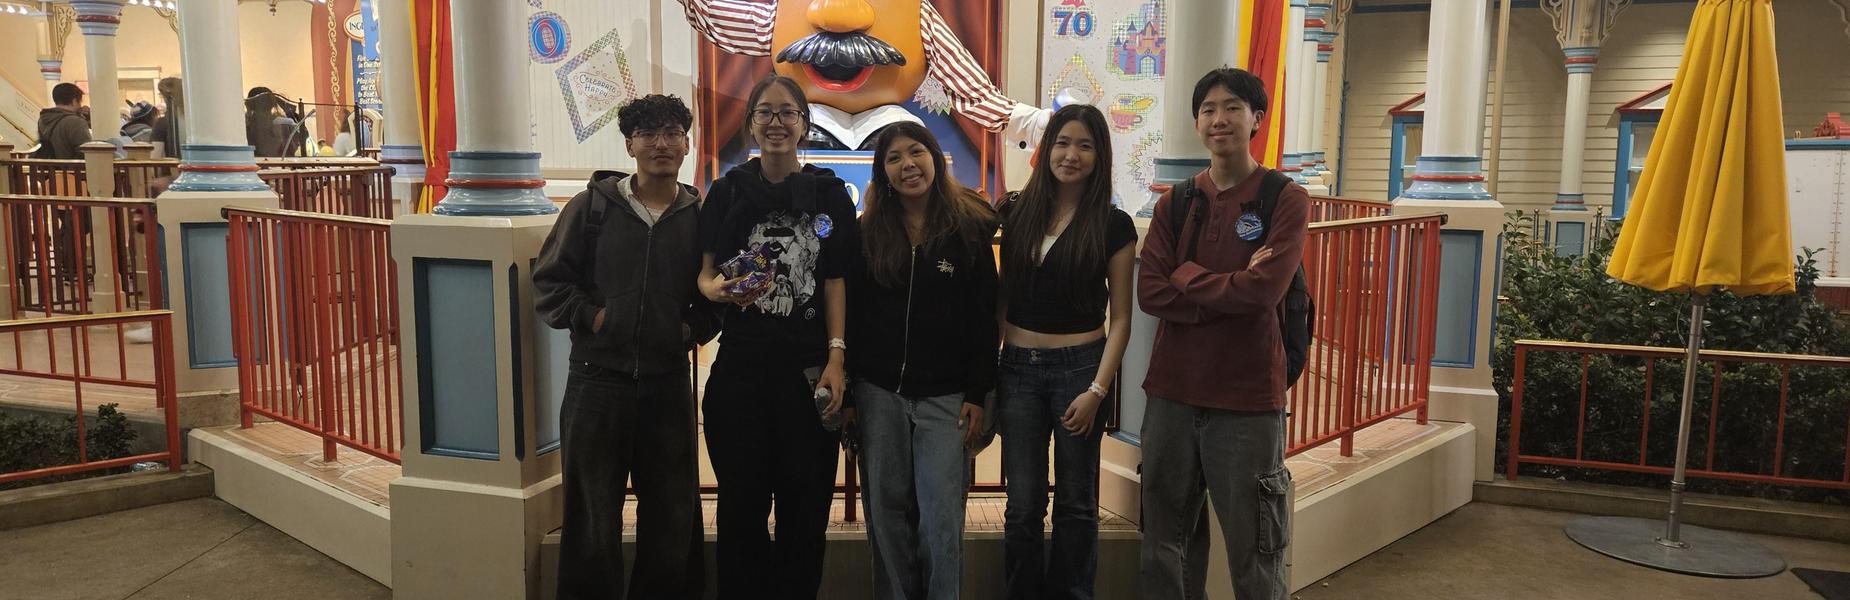
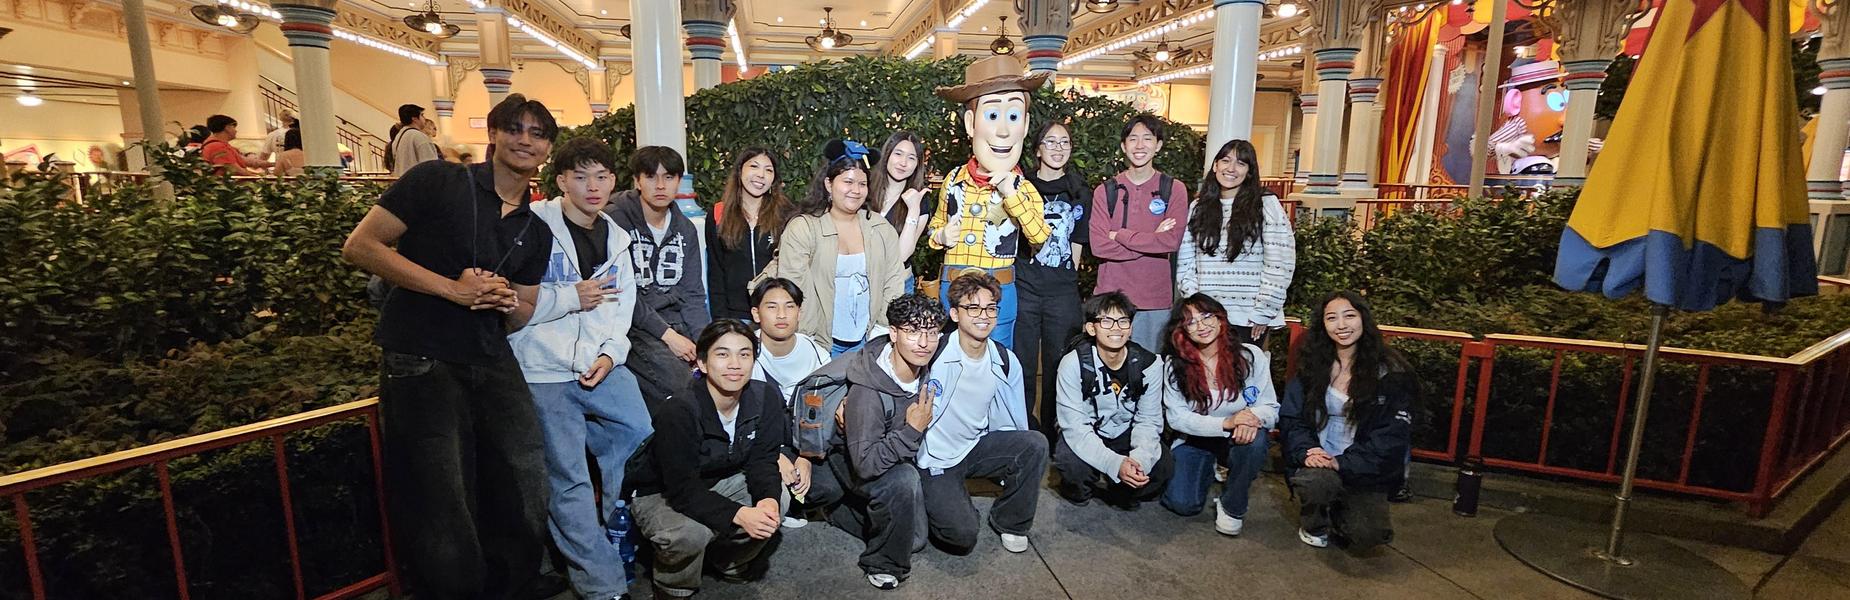
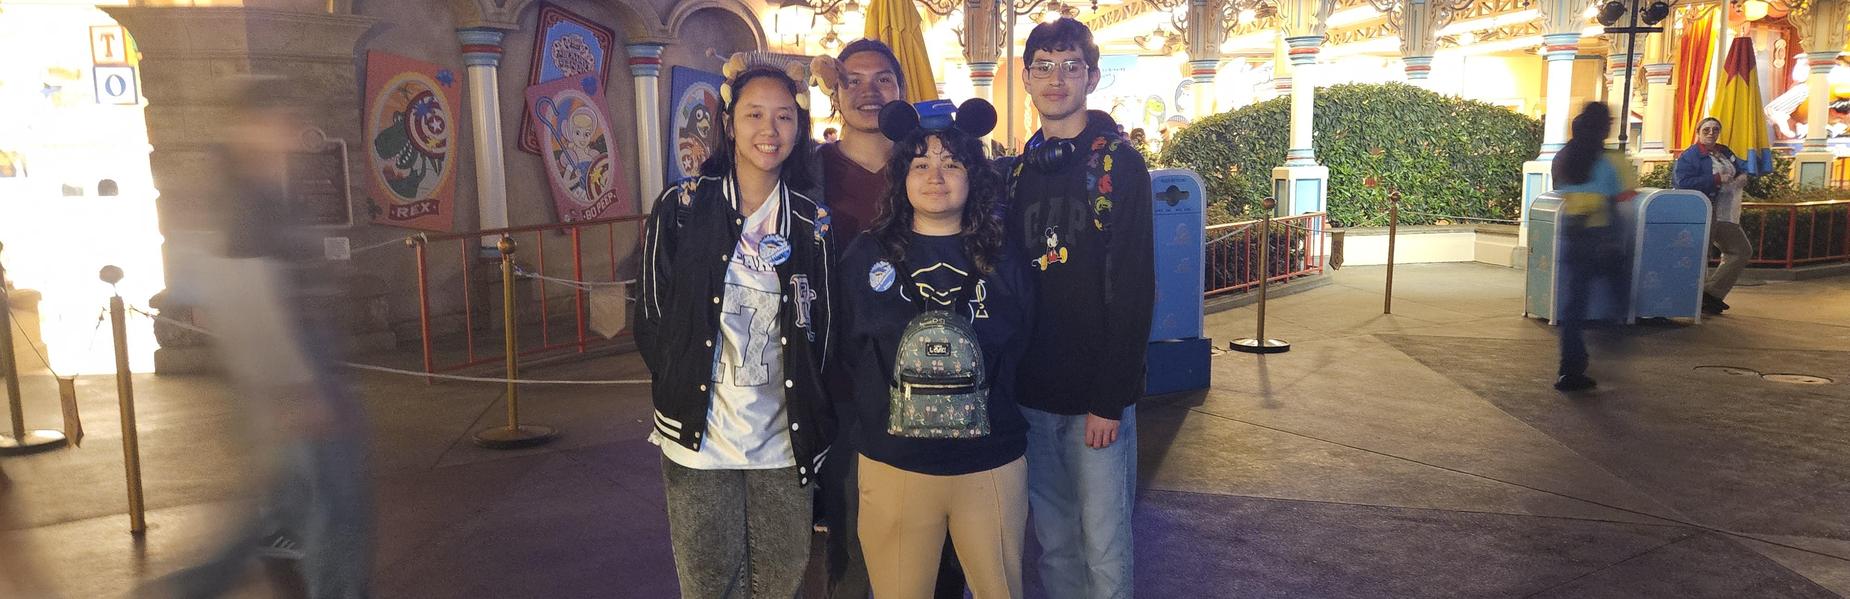
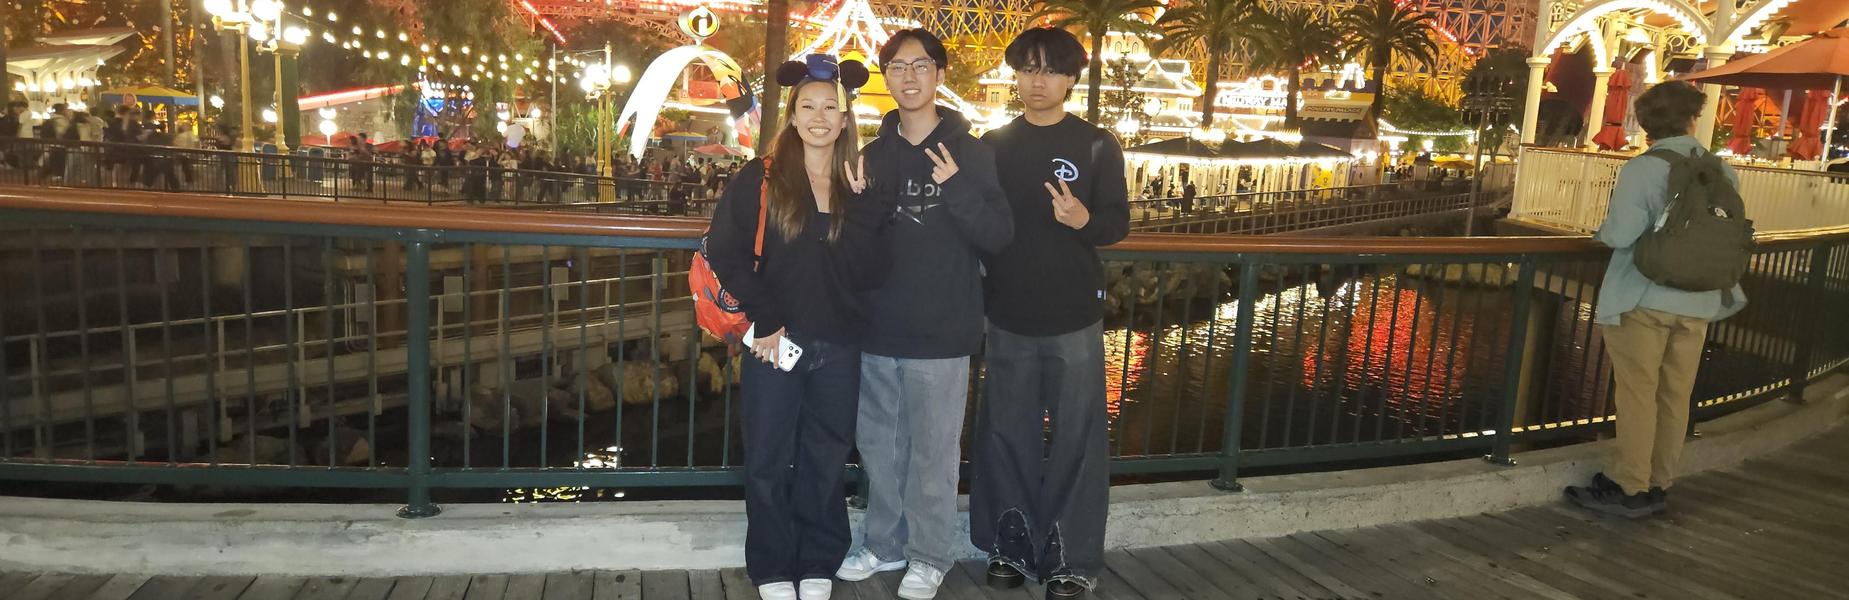
Time for the 14-Hour Grad Nite Marathon!
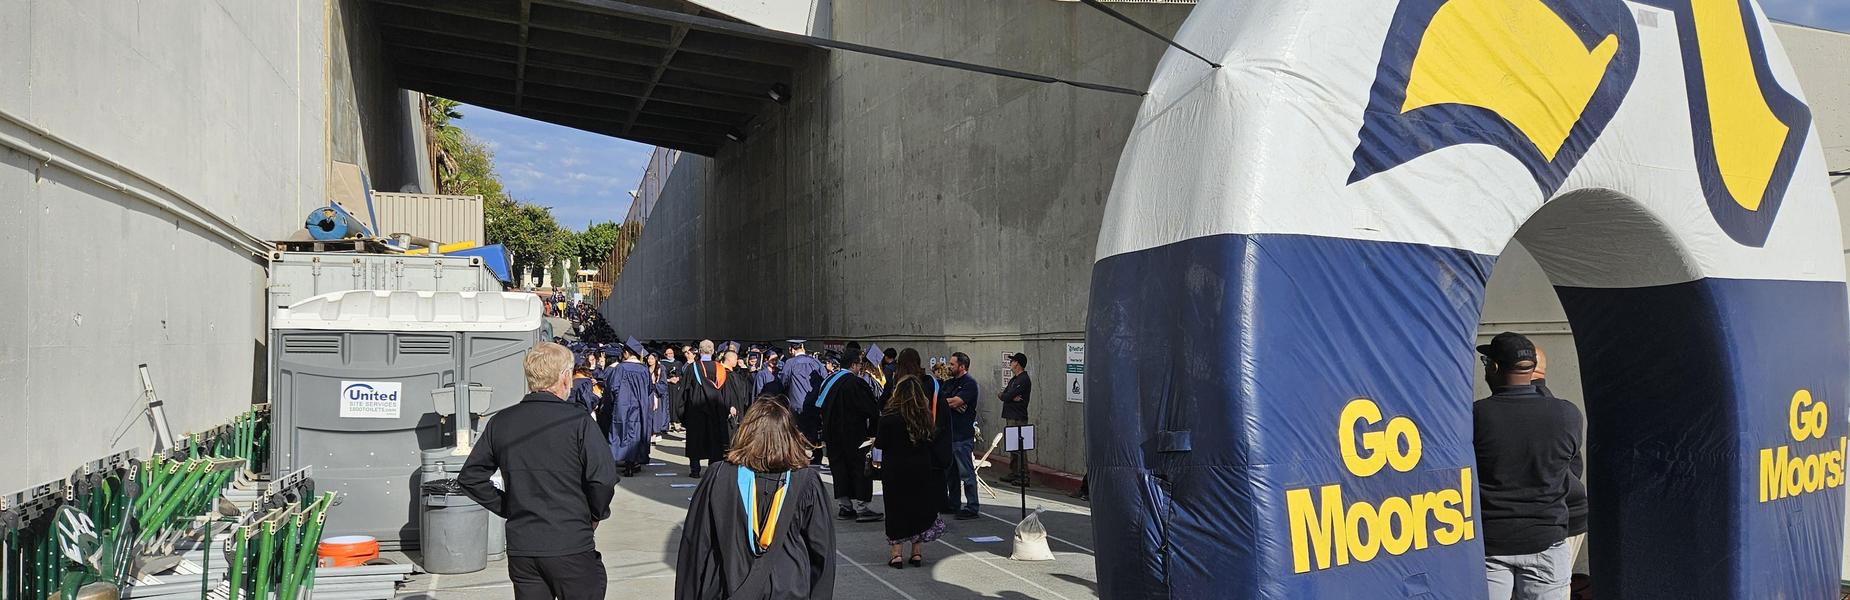
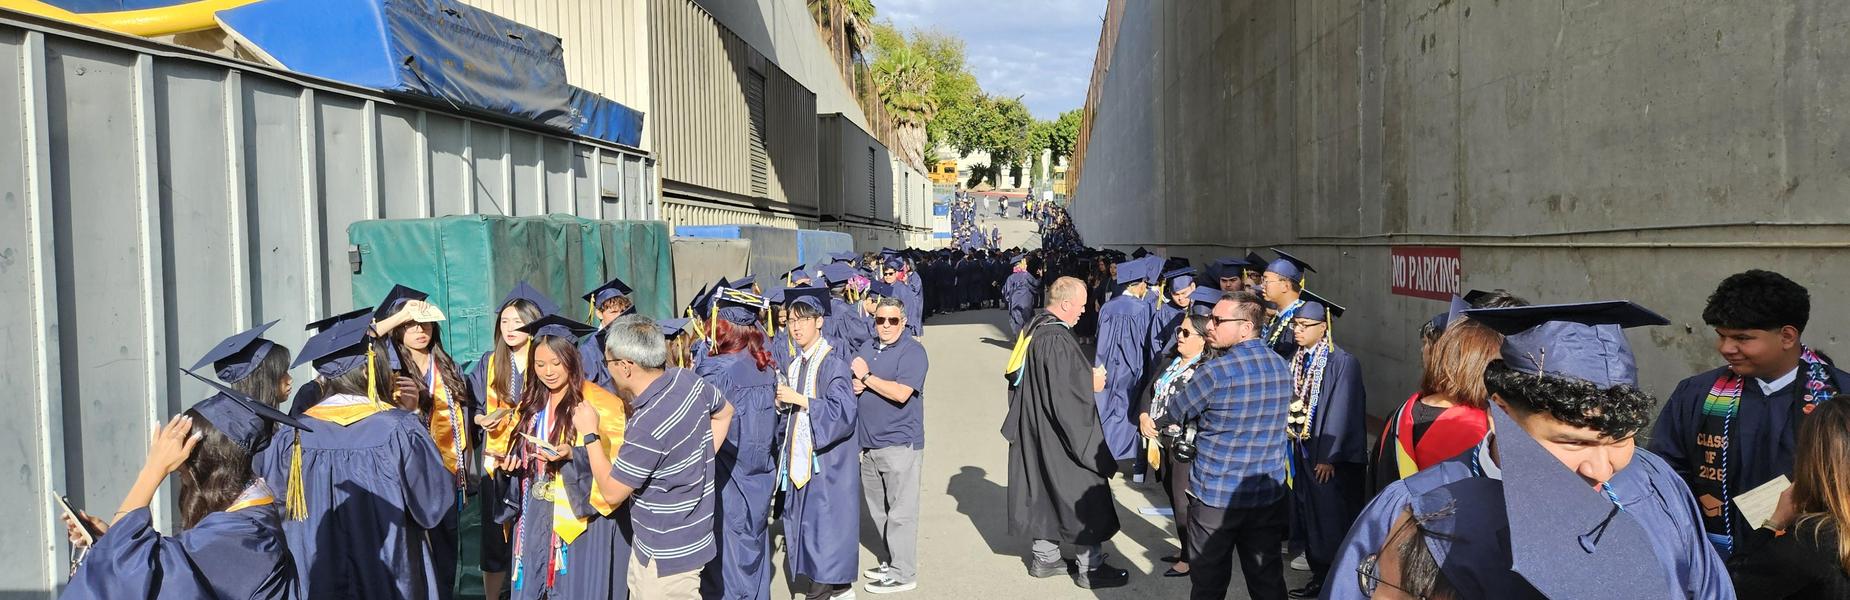
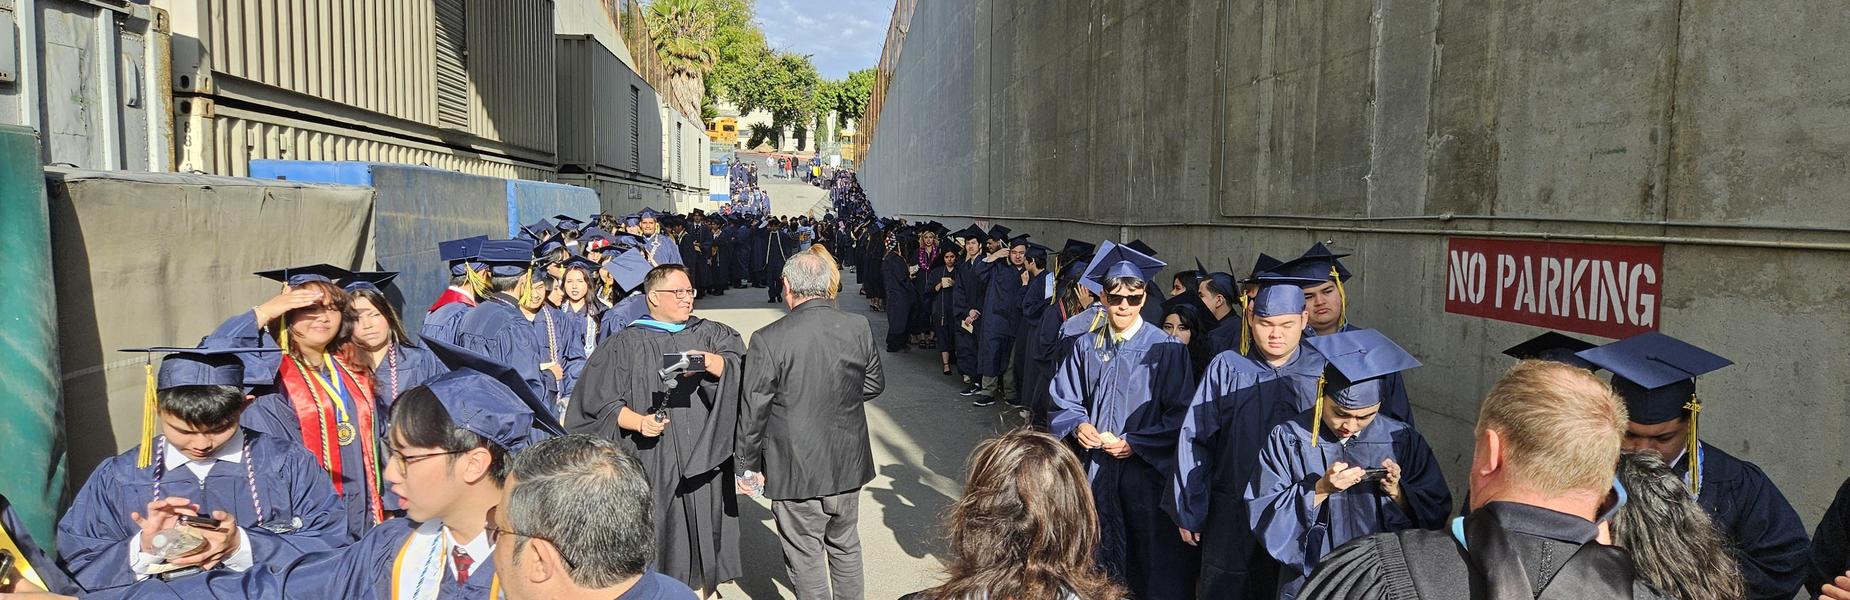
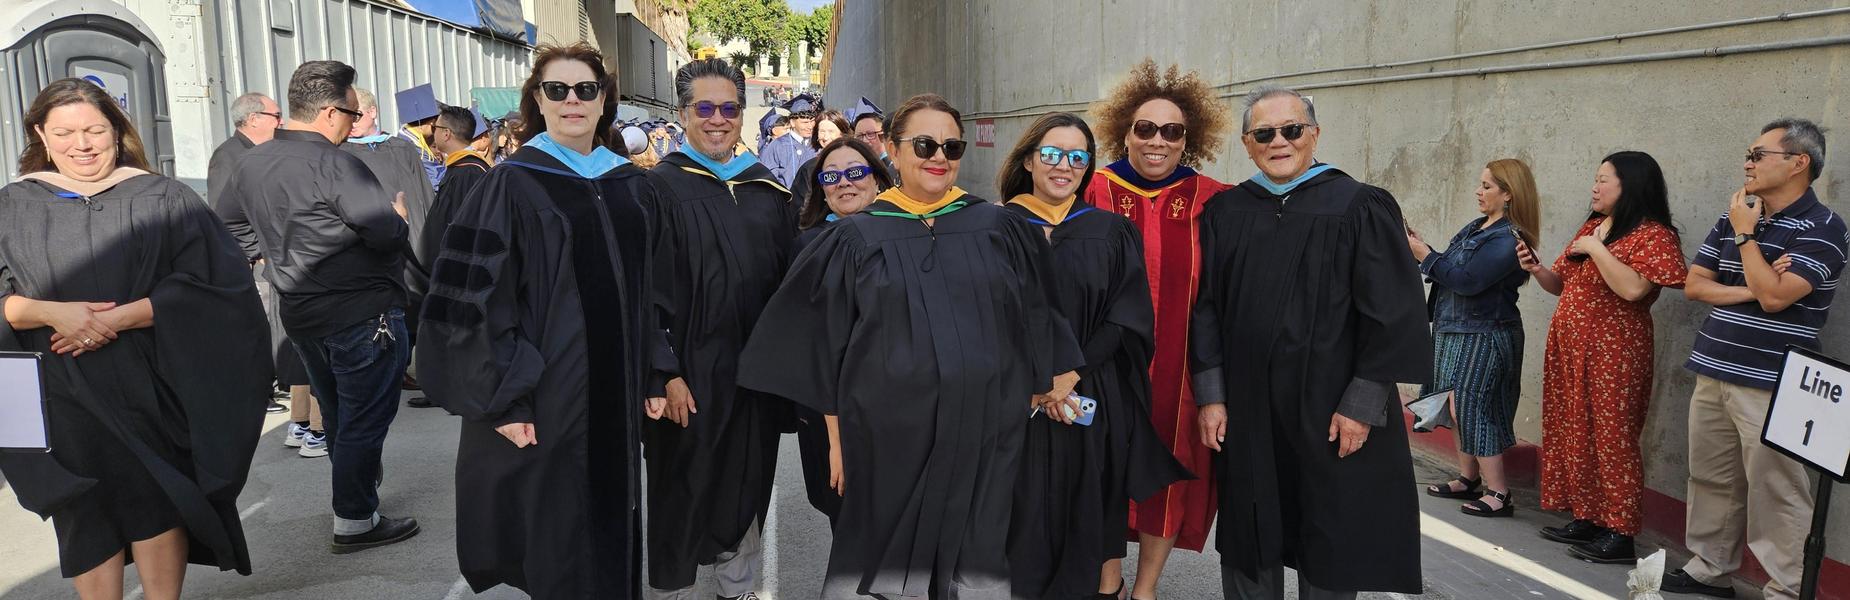
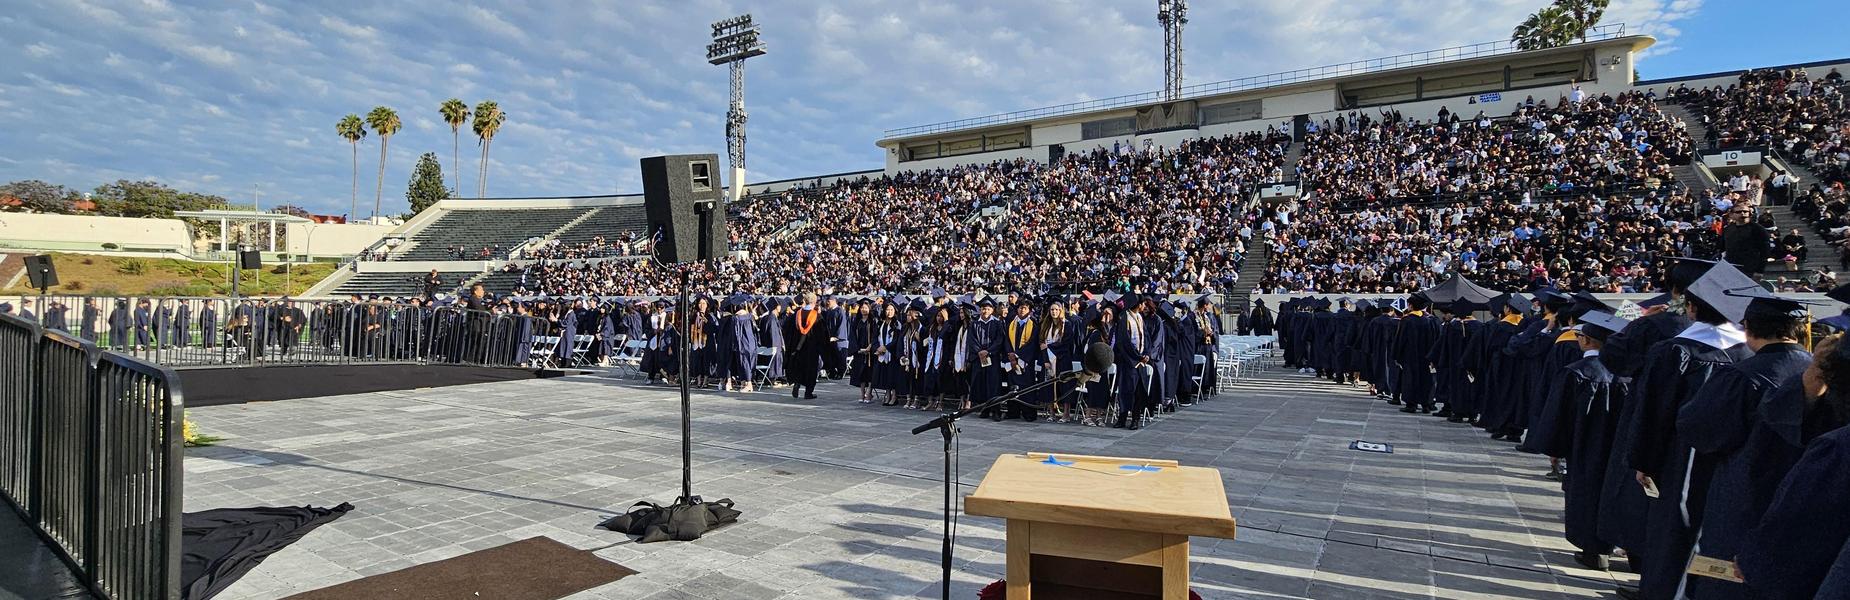
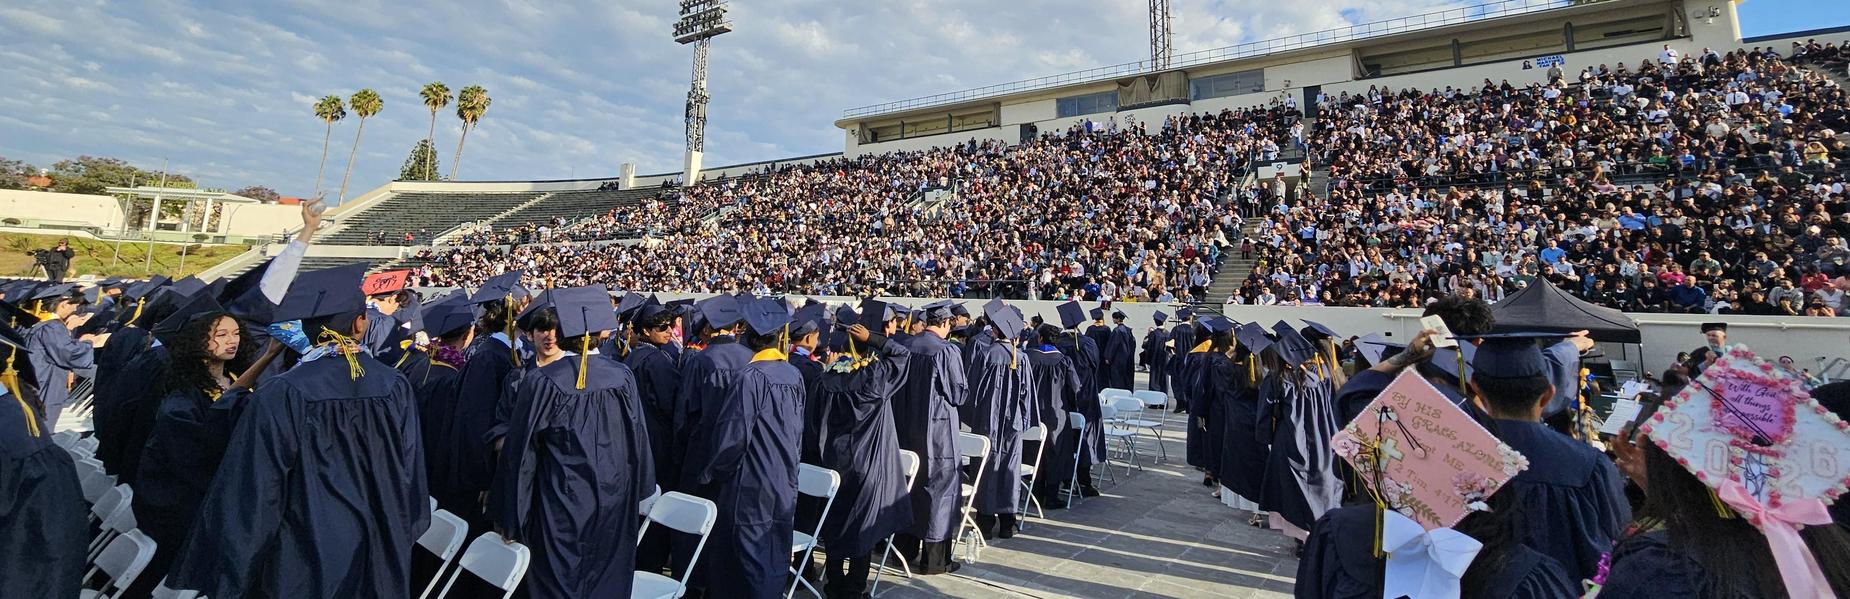
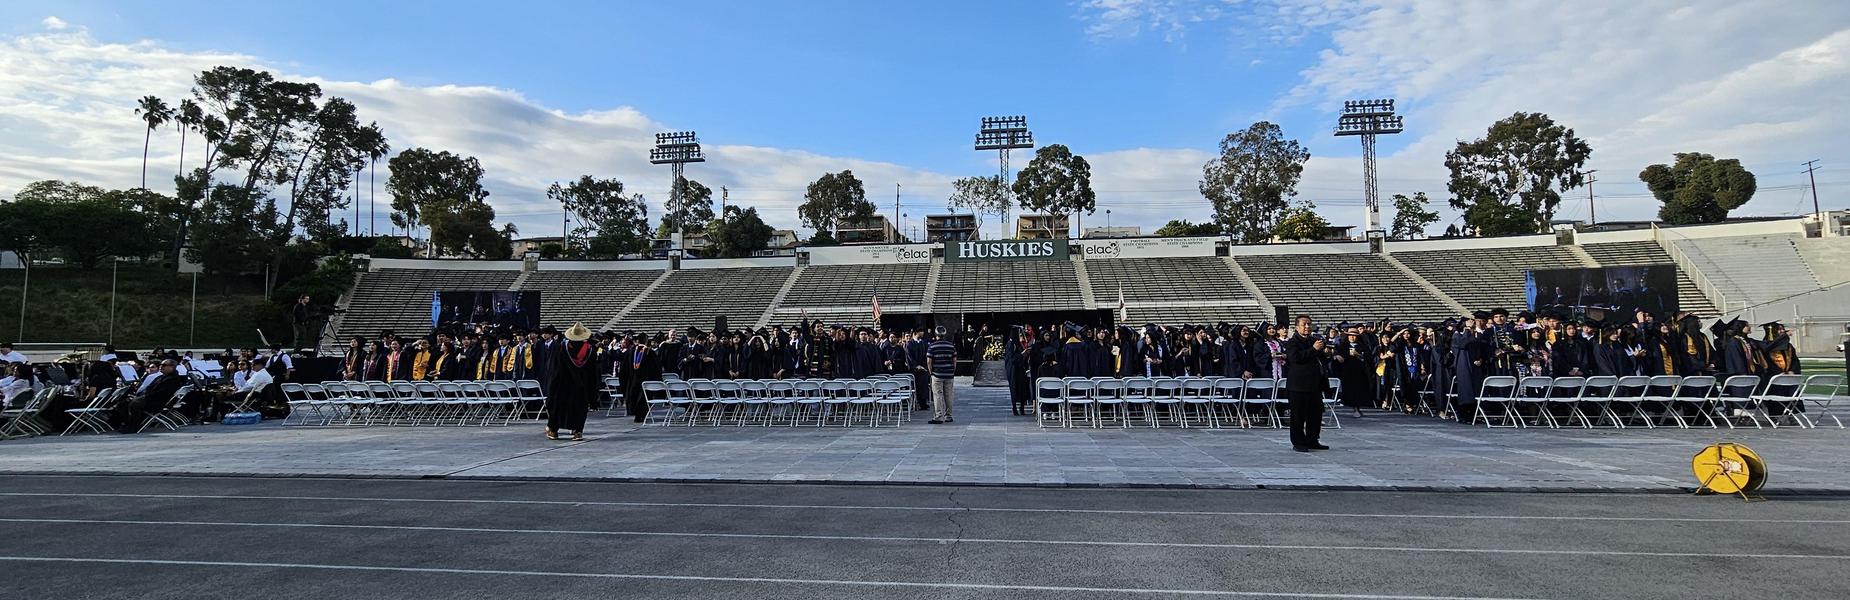
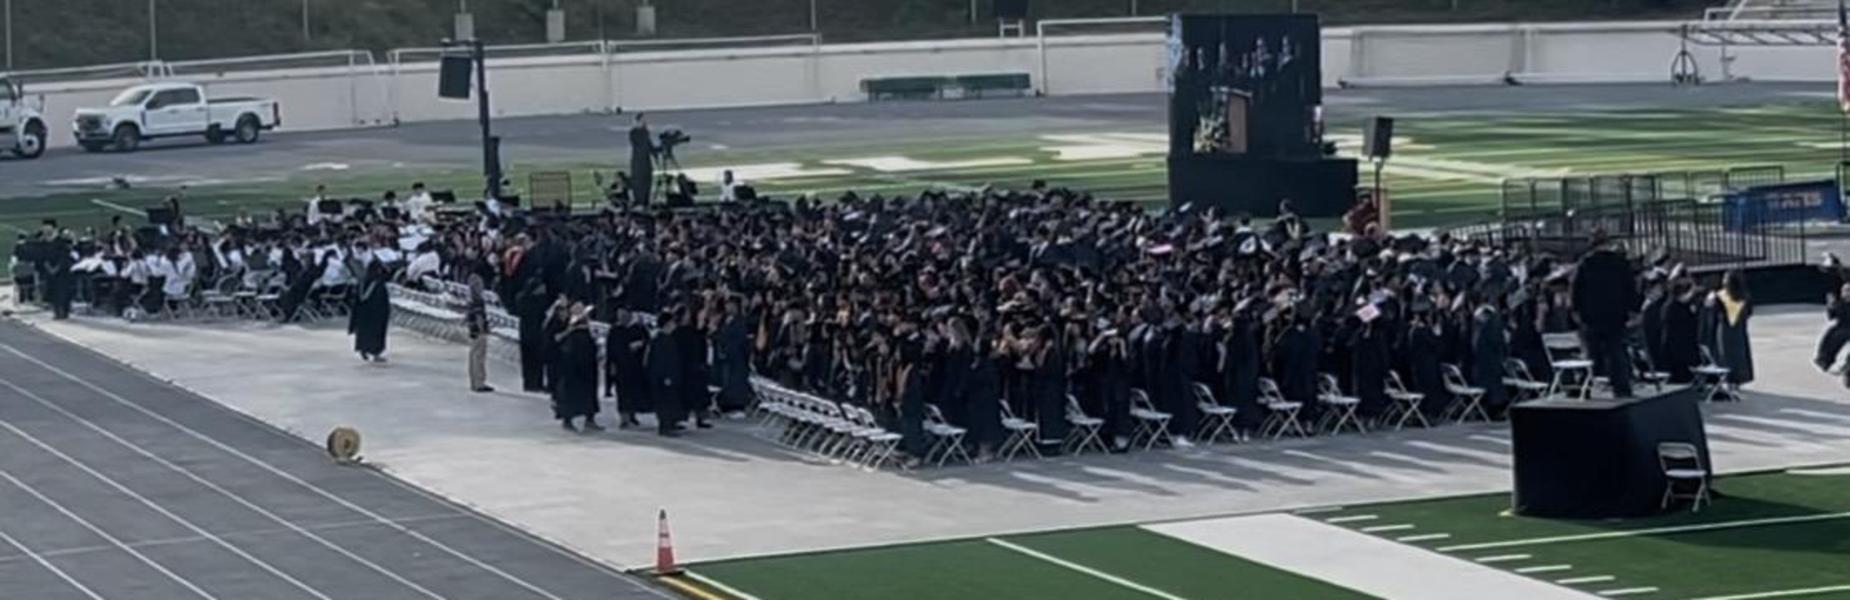
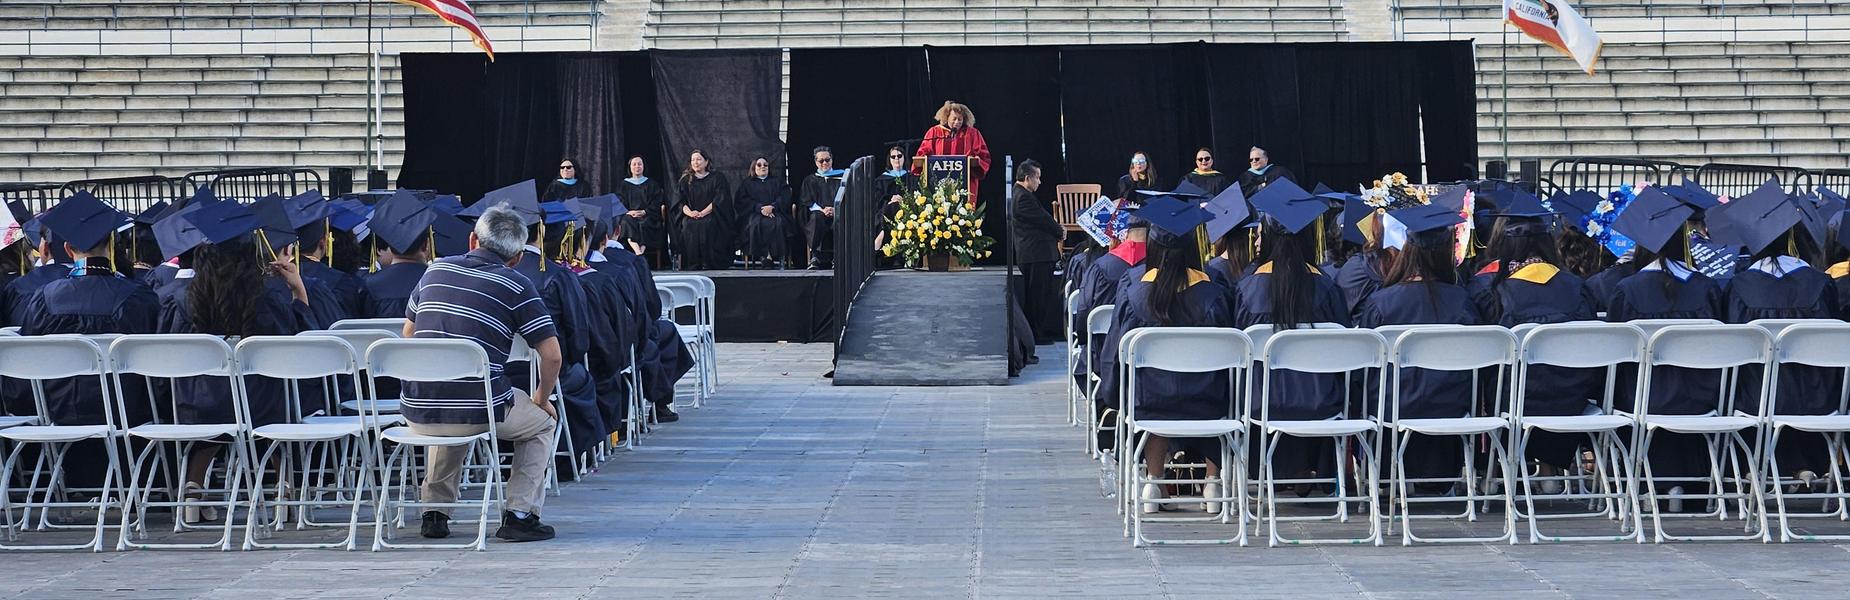
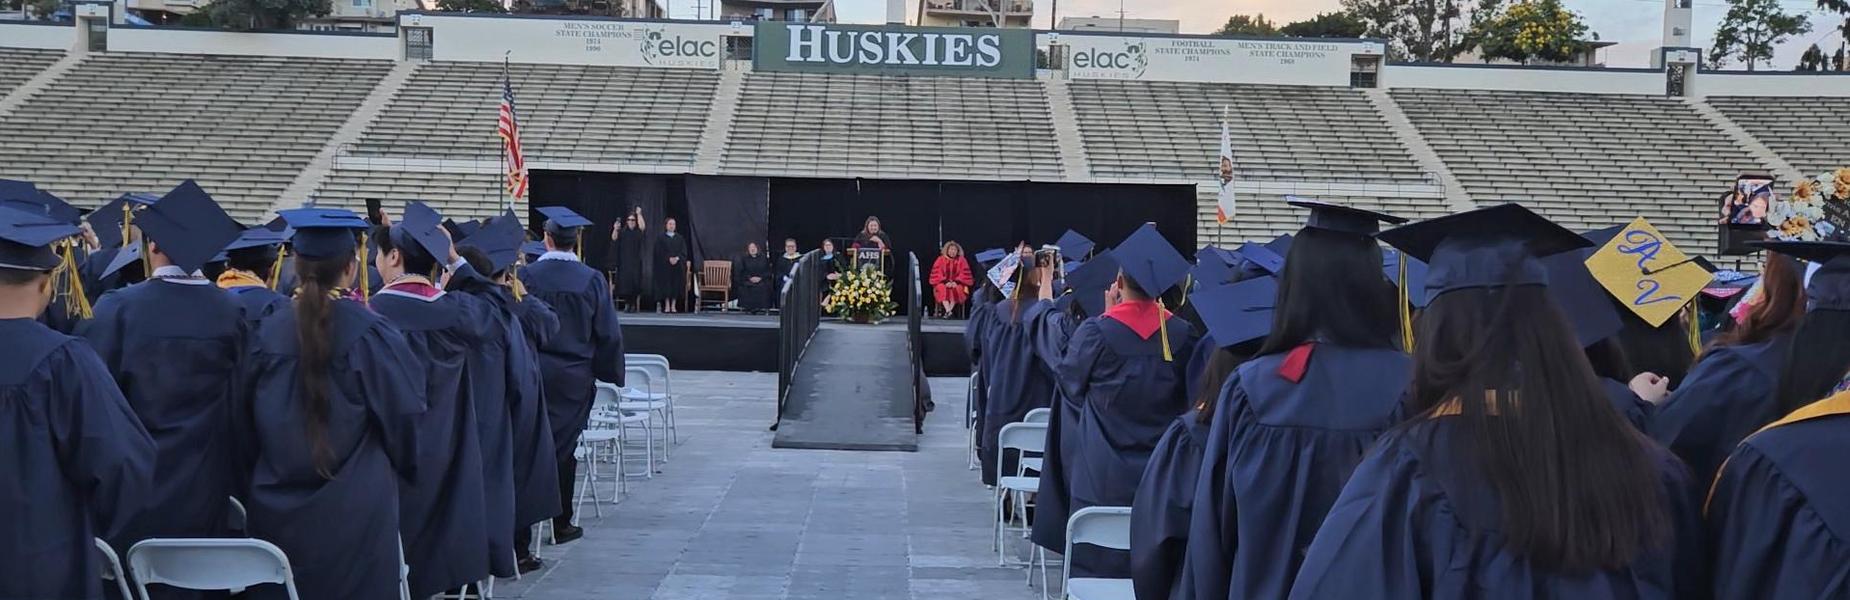
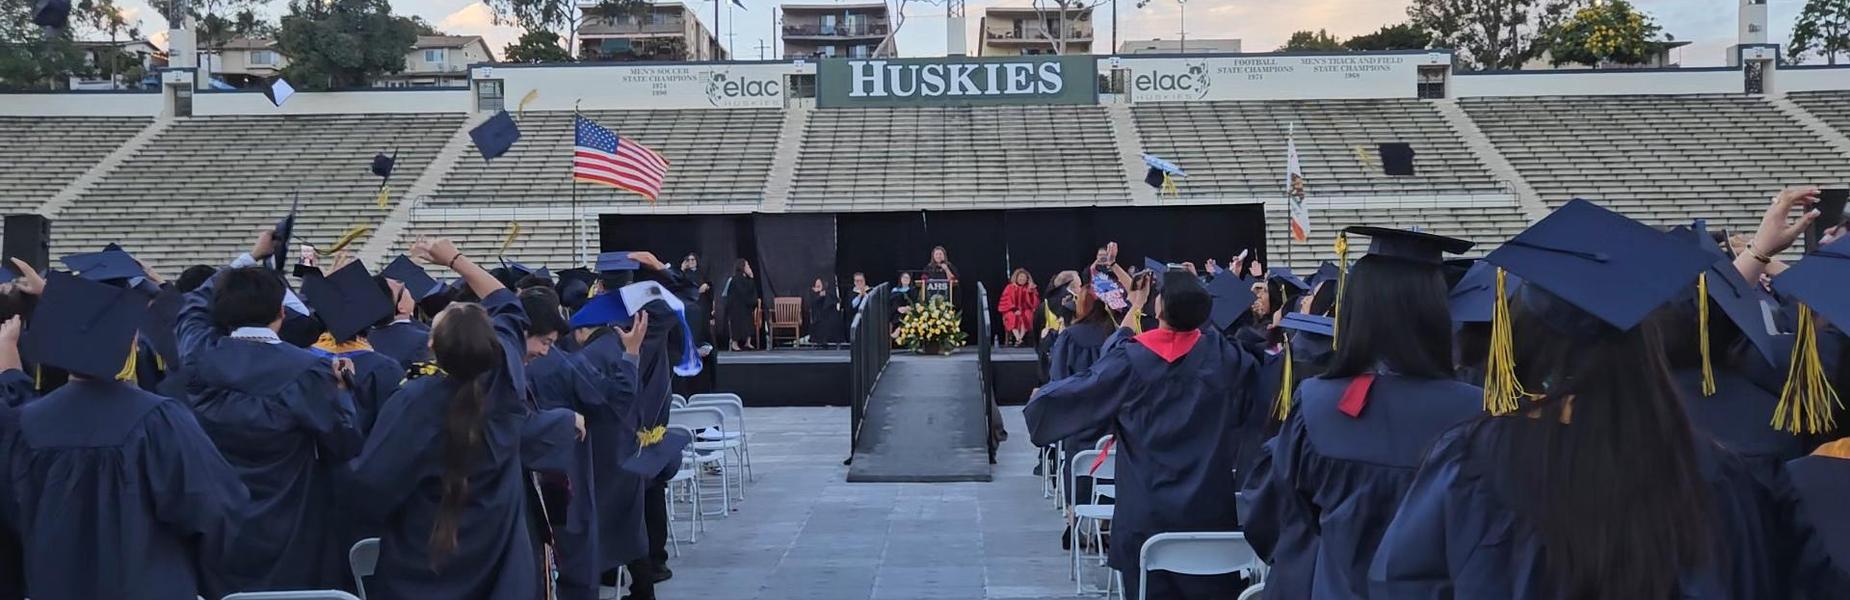
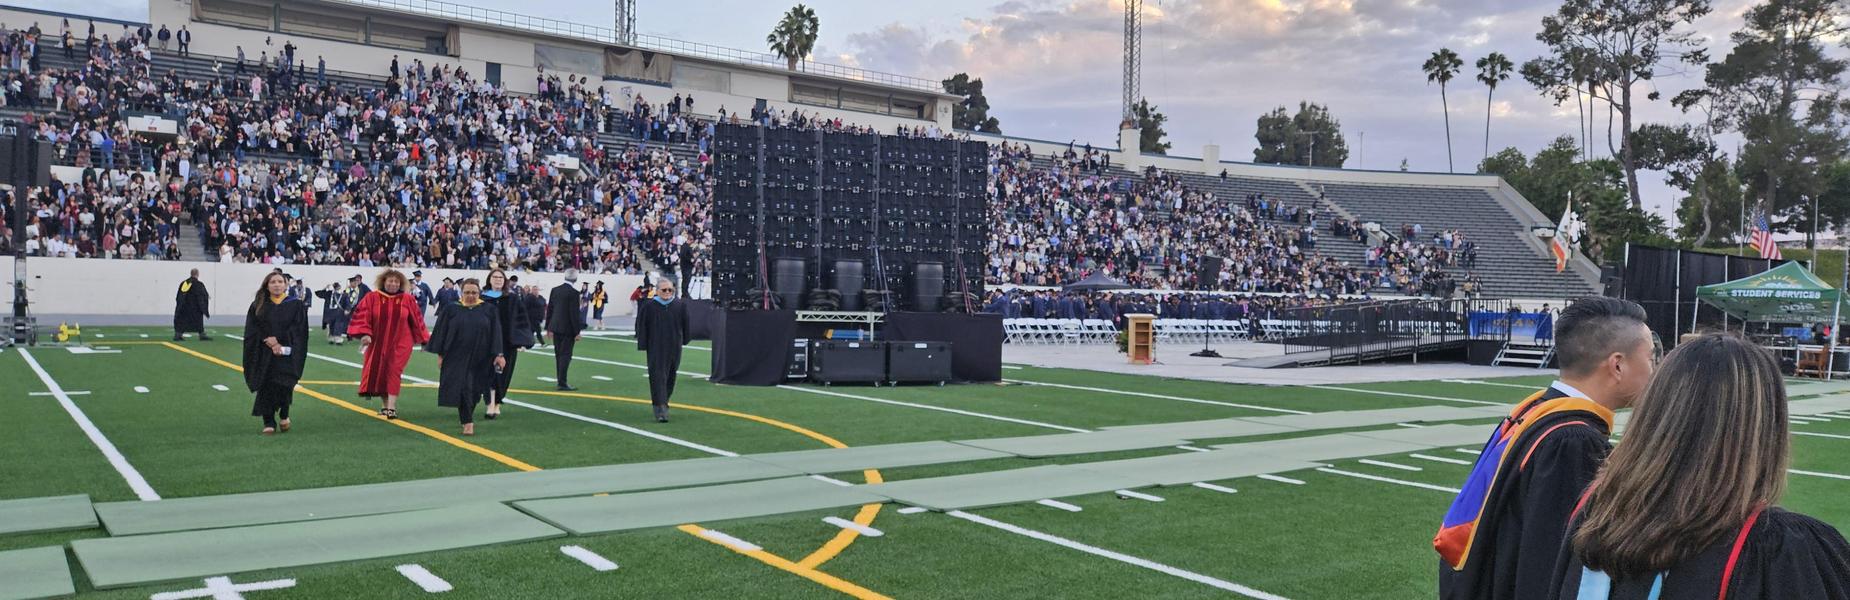
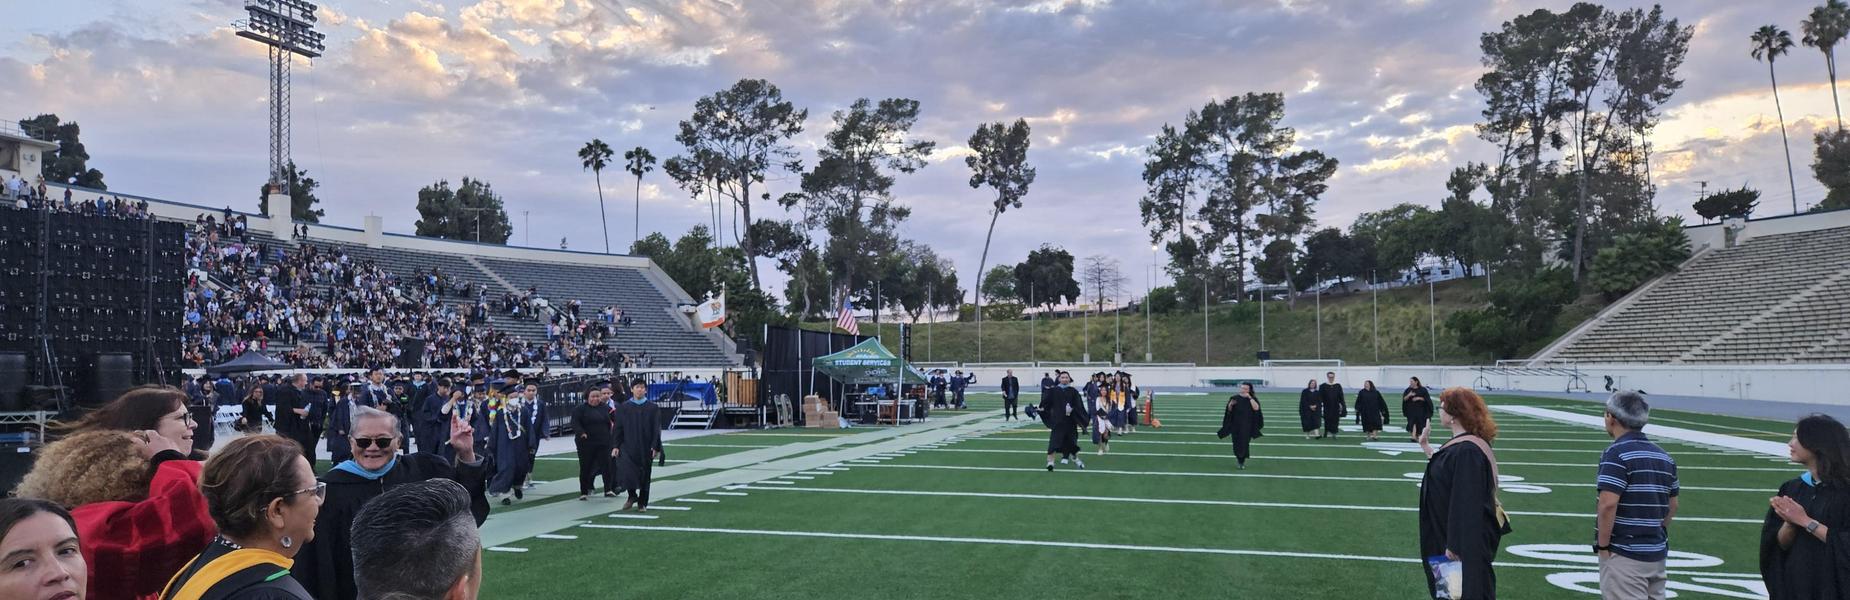
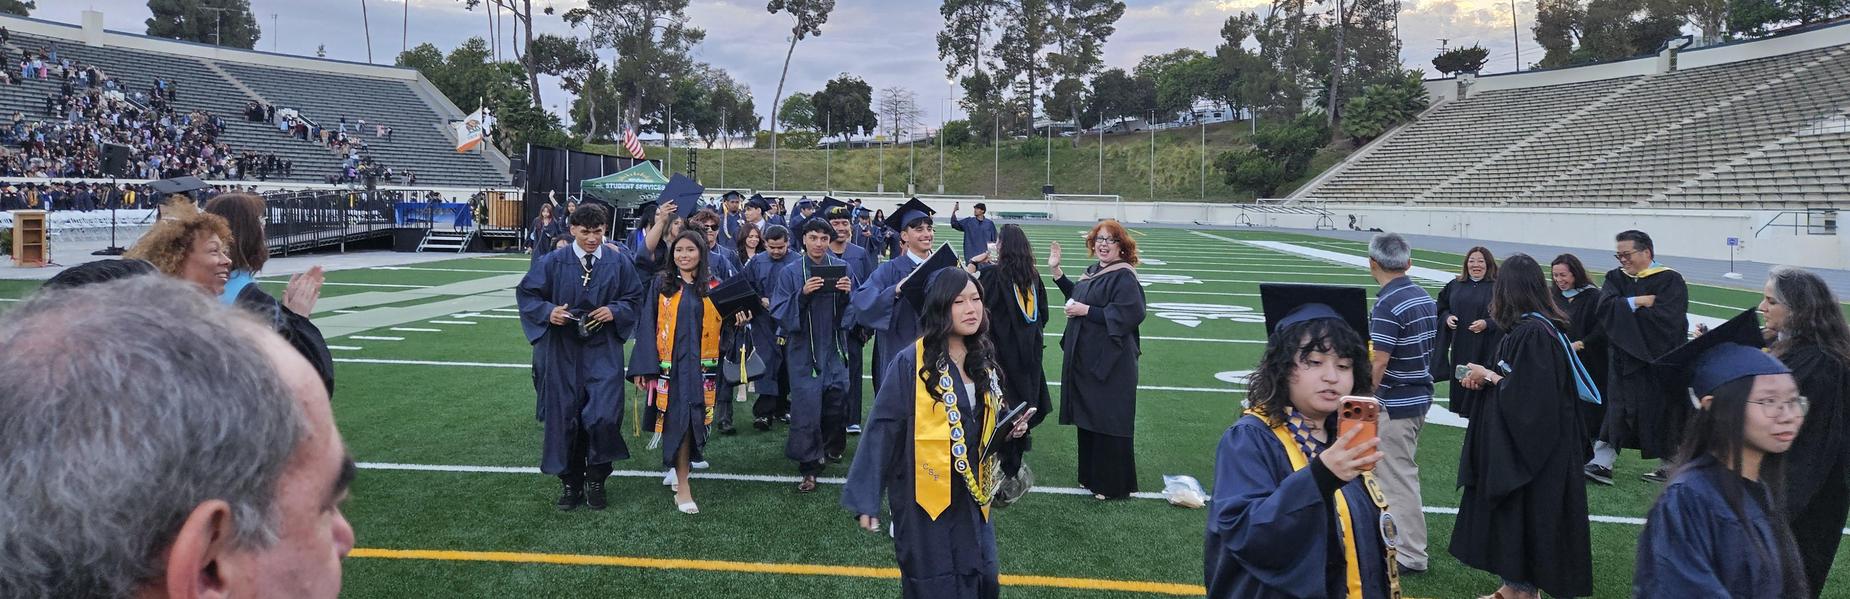
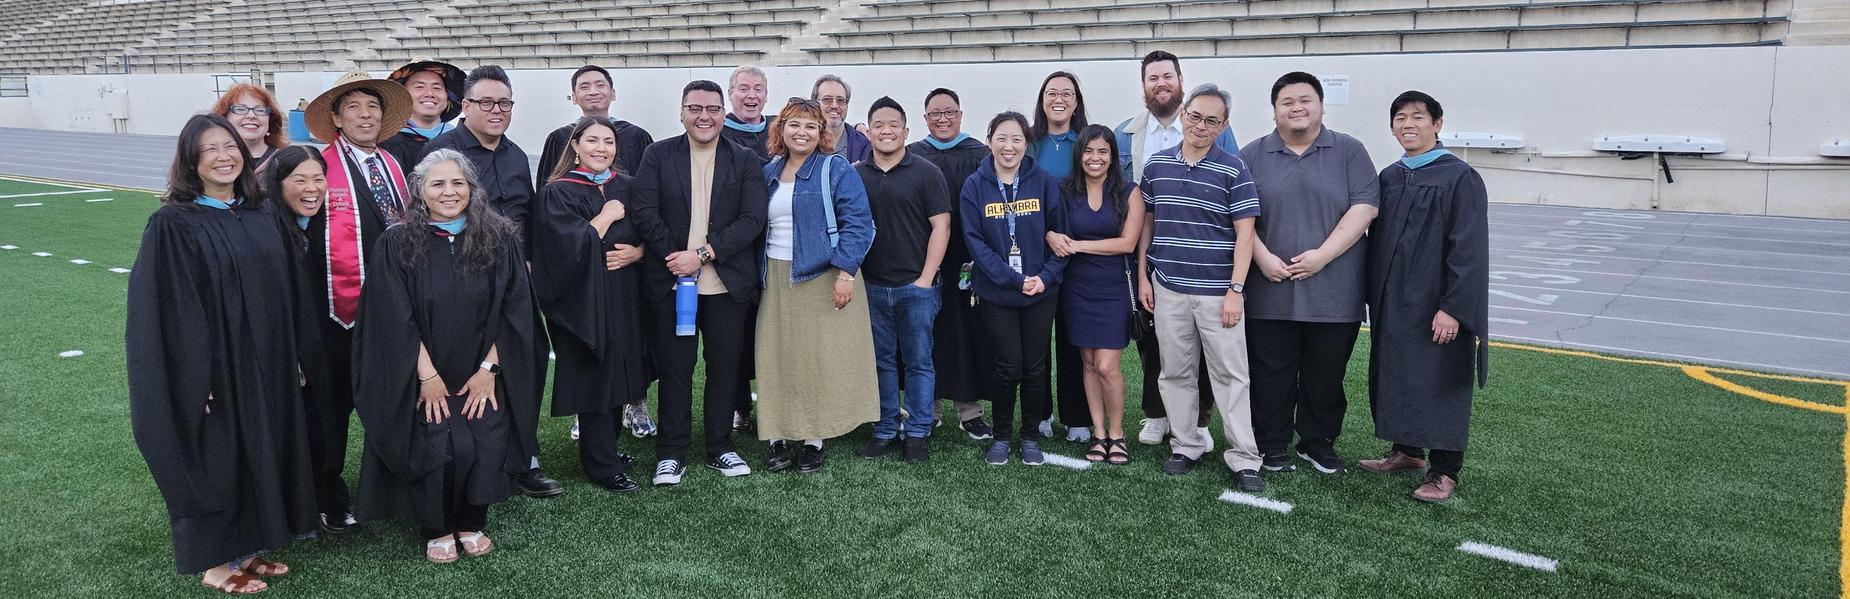
Congratulations to all of our graduates!
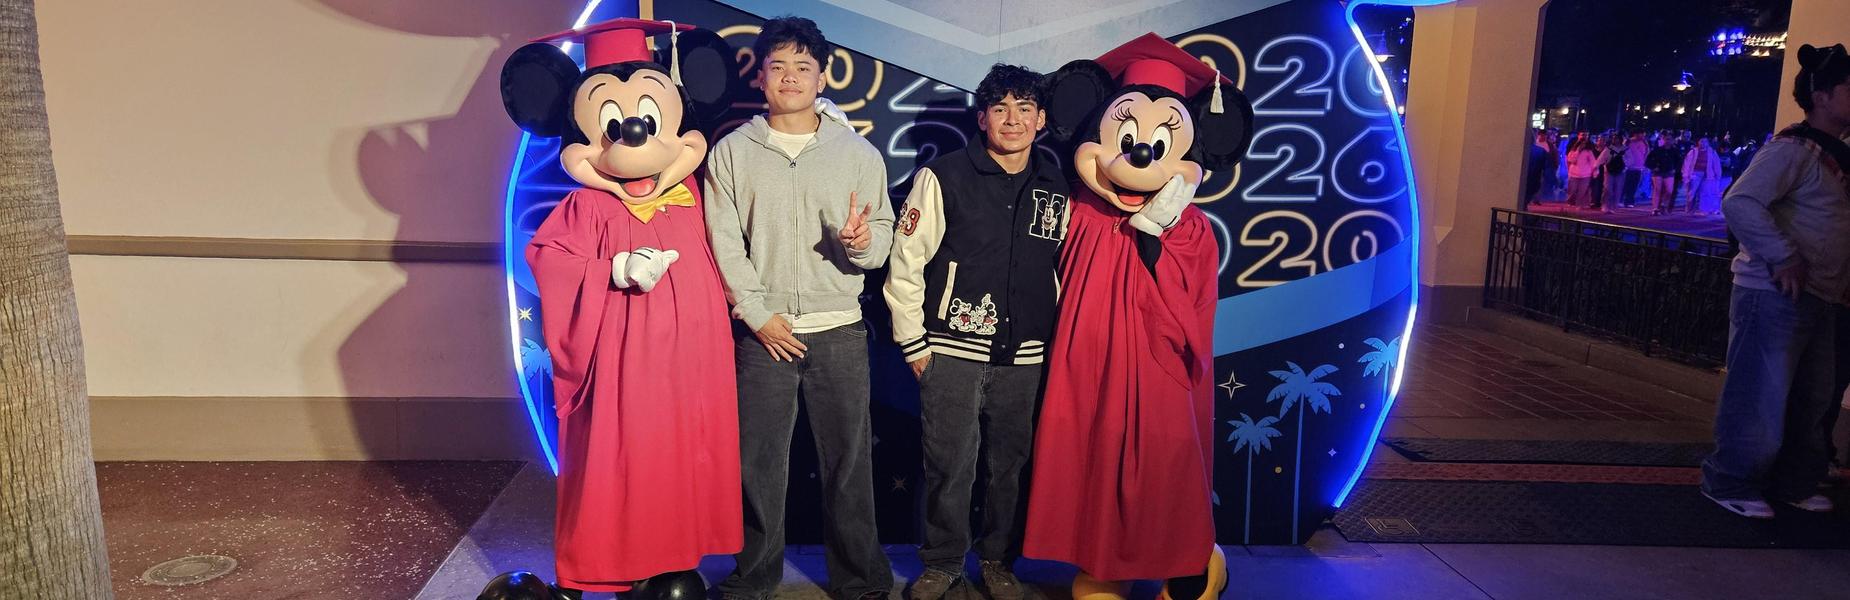
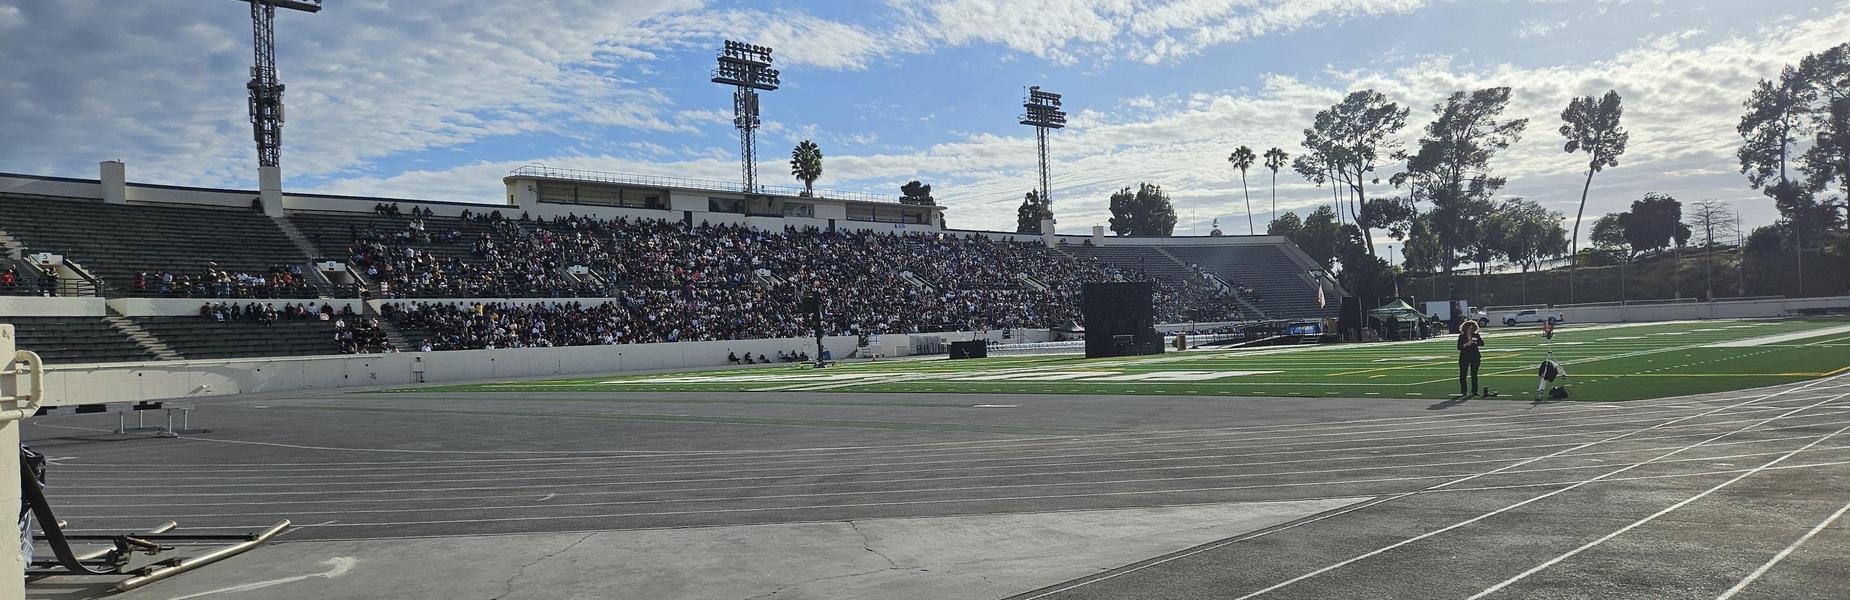
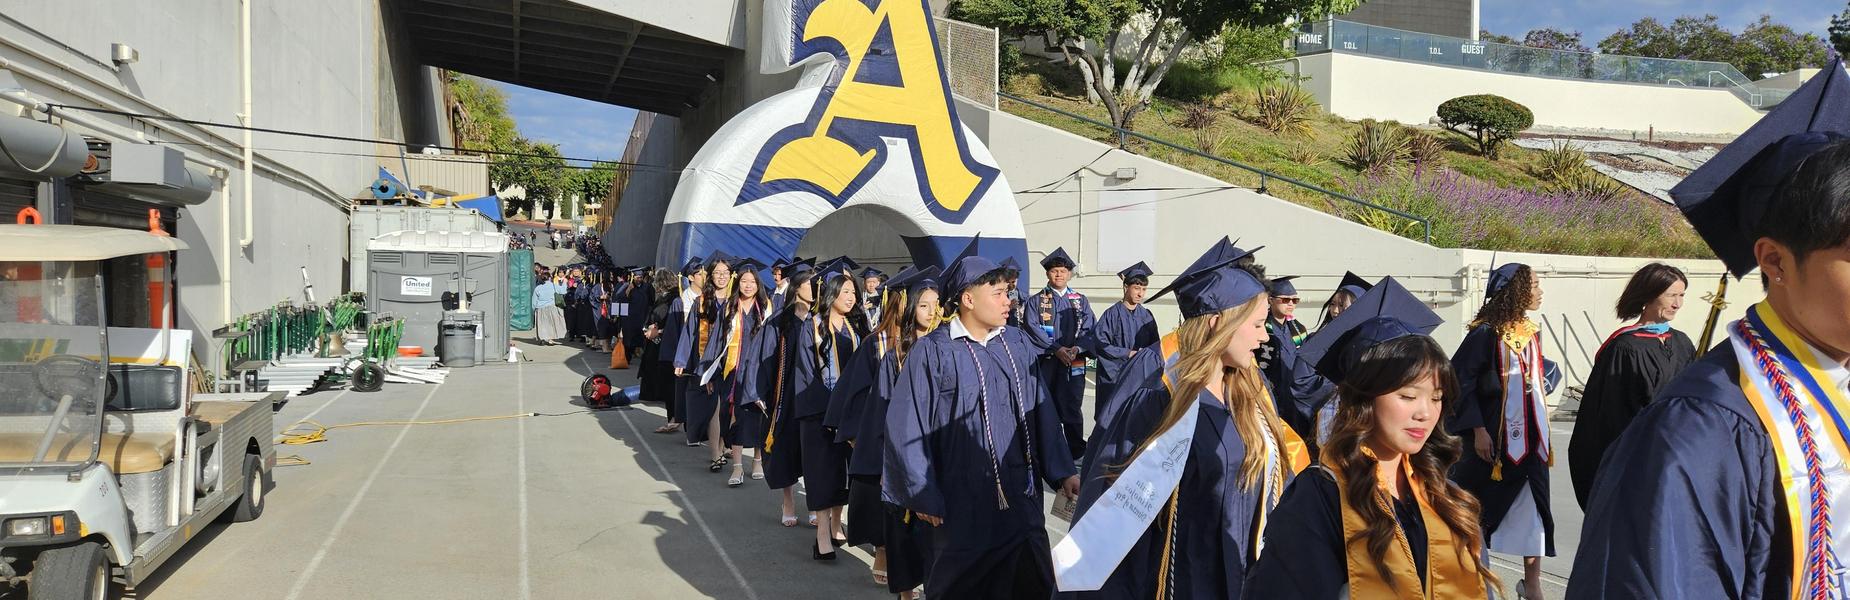
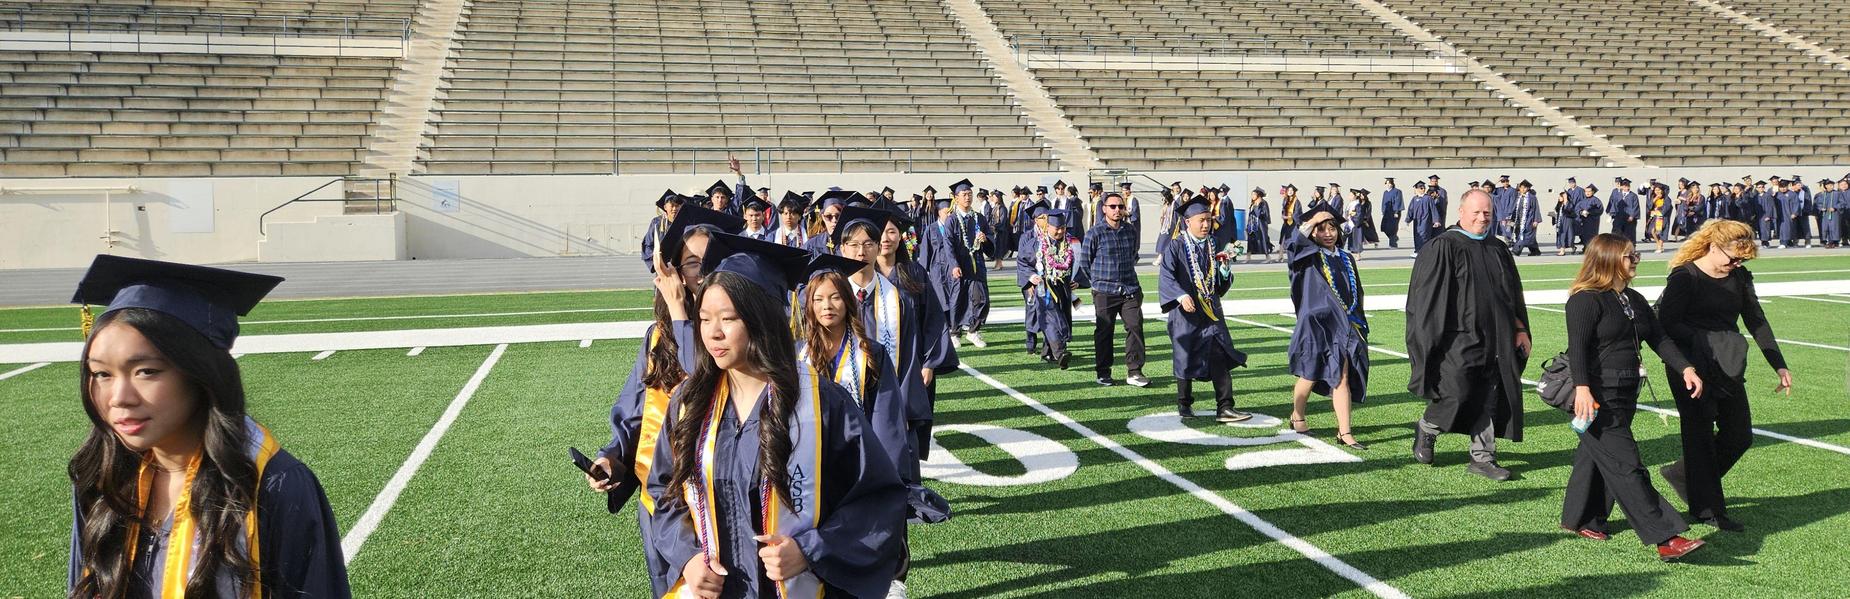
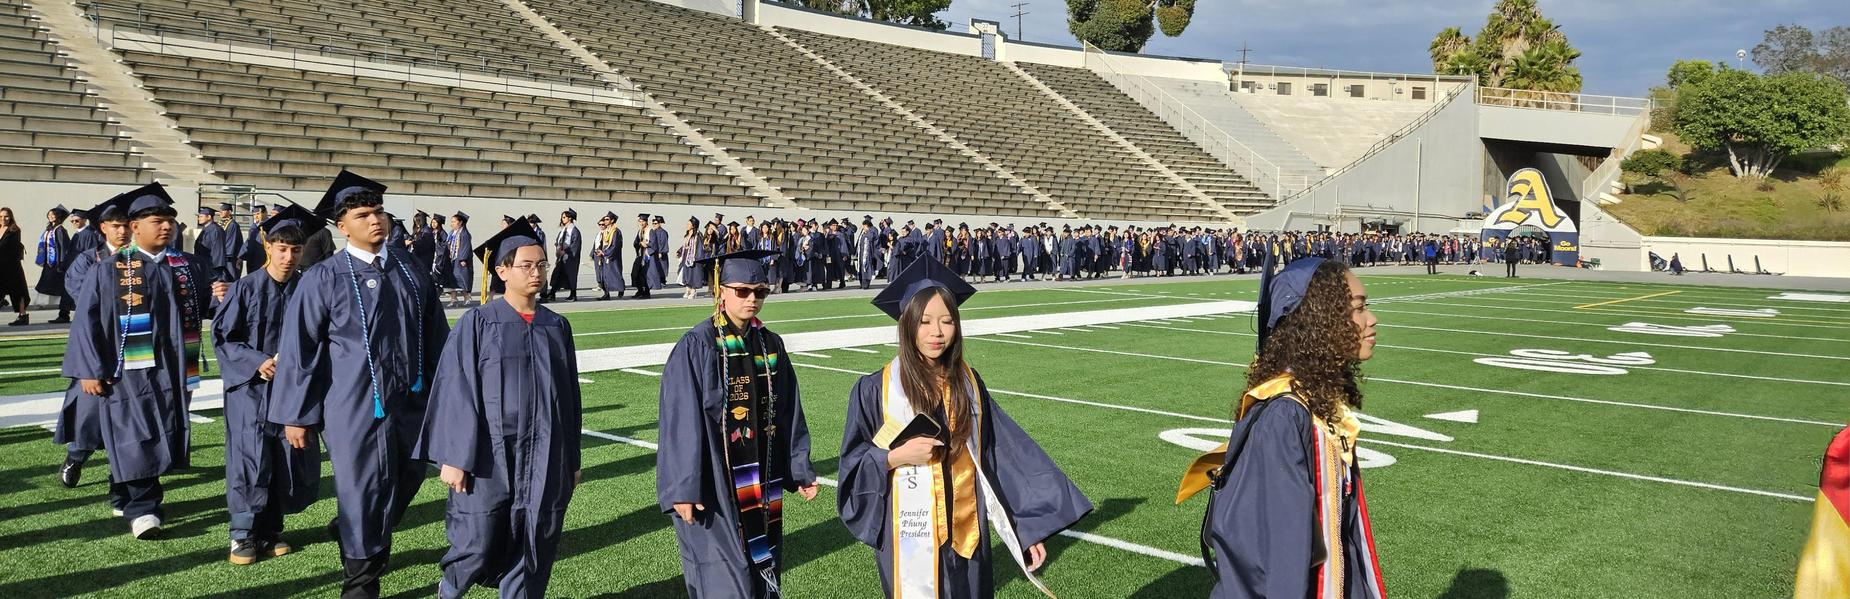
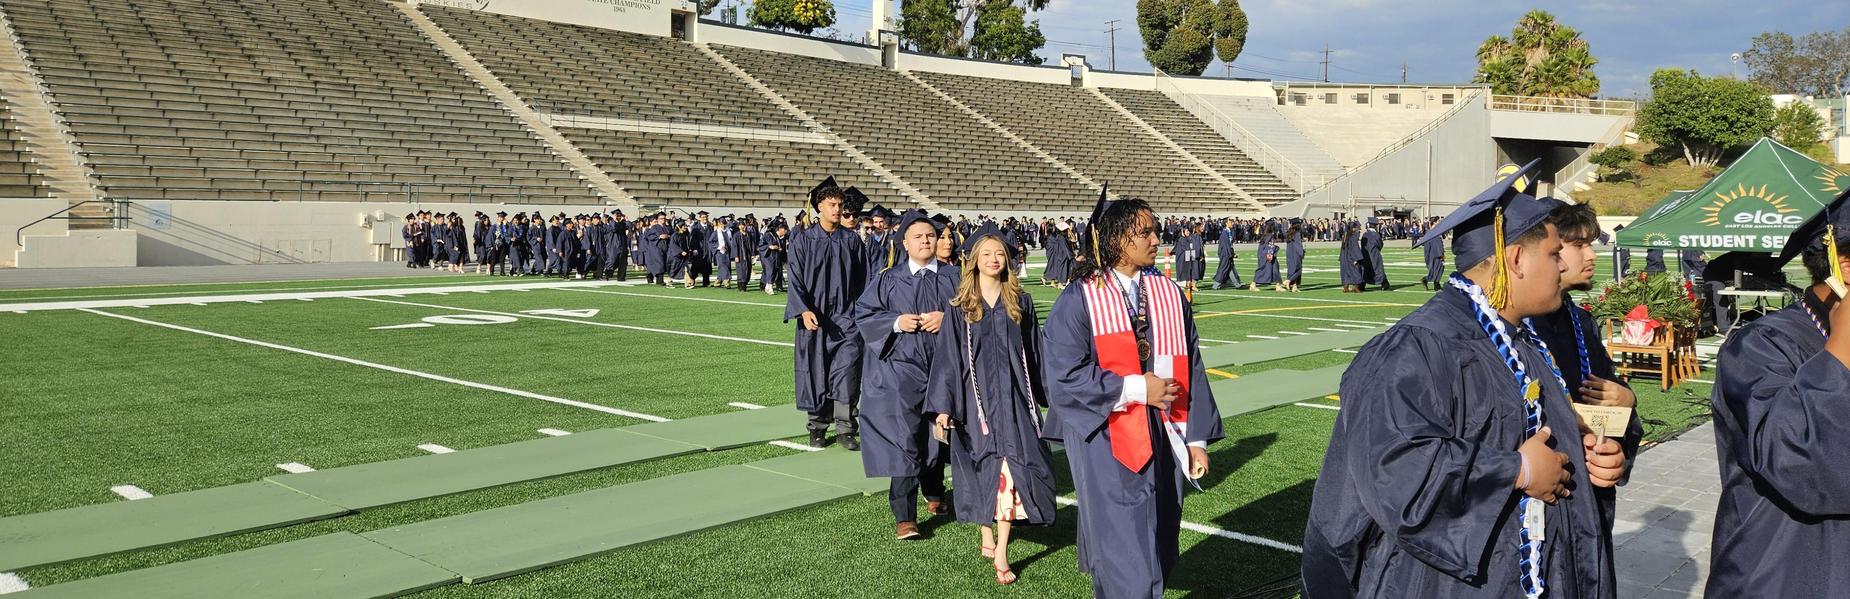
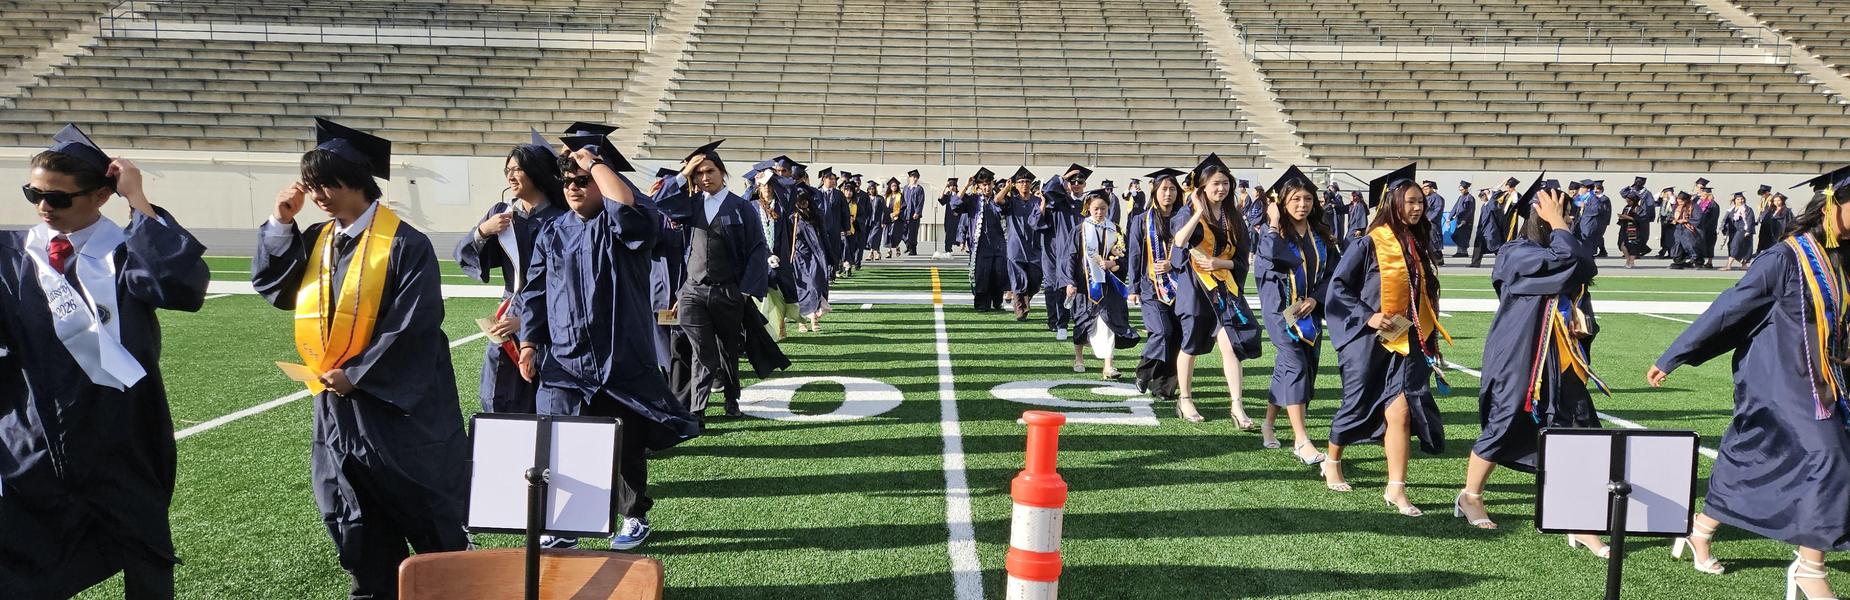
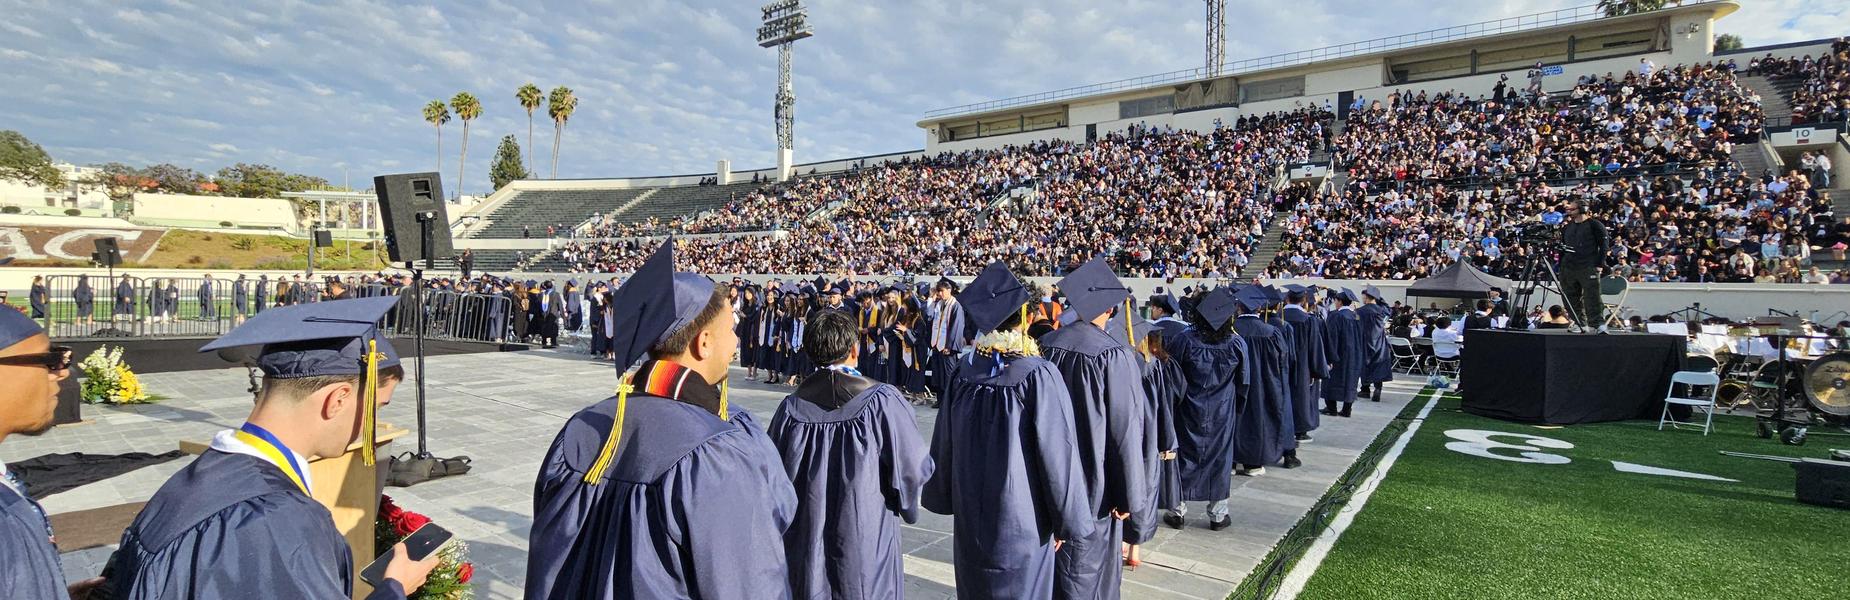
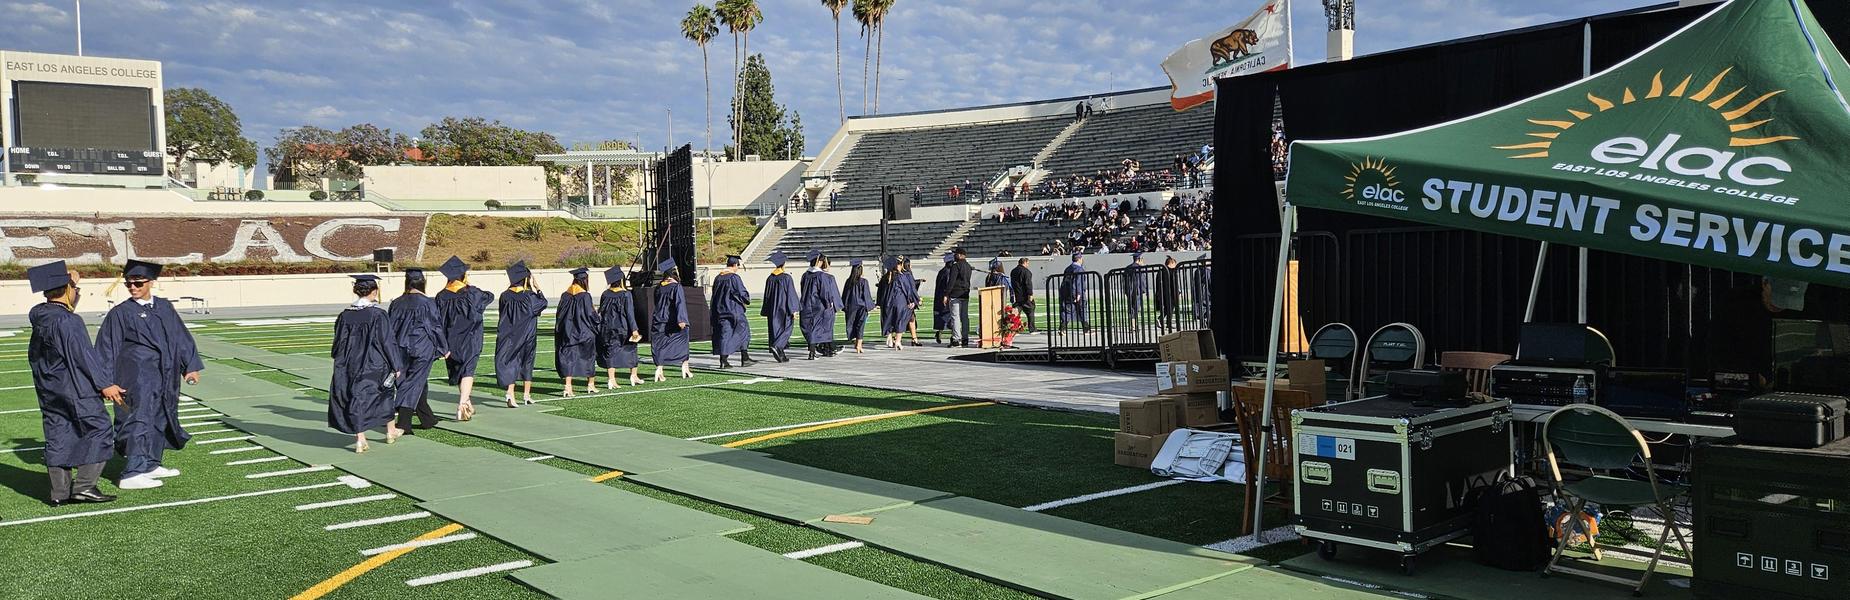
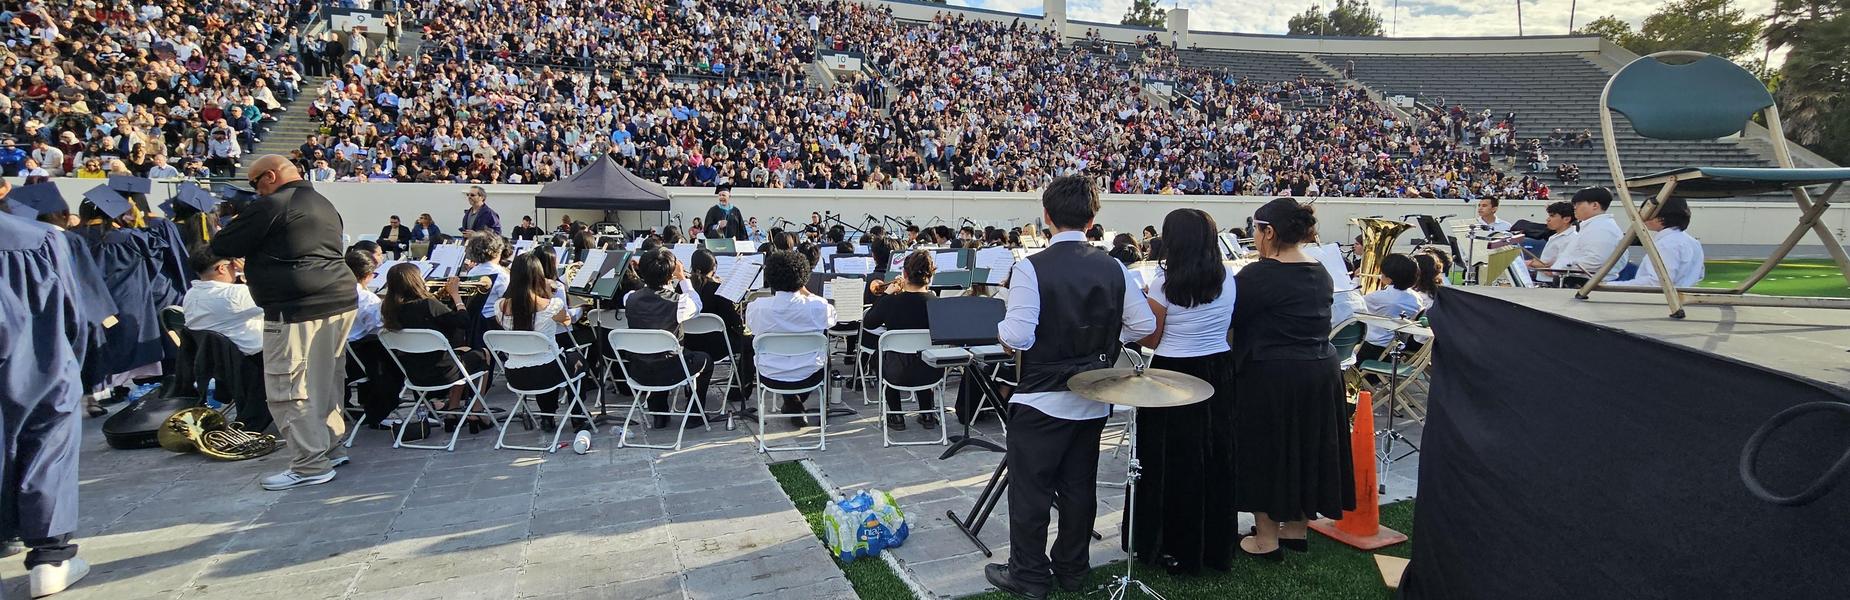
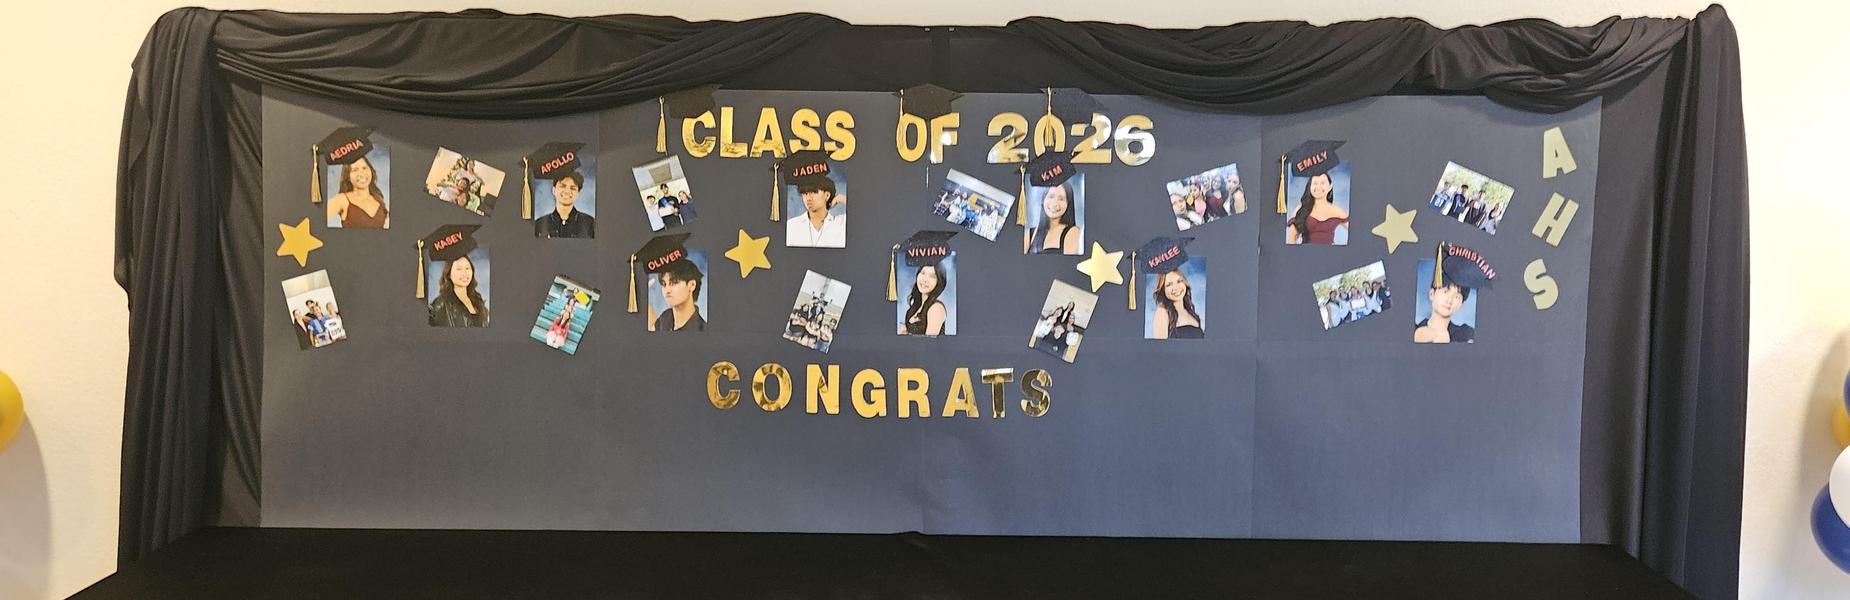
Graduation 2026!
It's the Yearbook Launch Party!
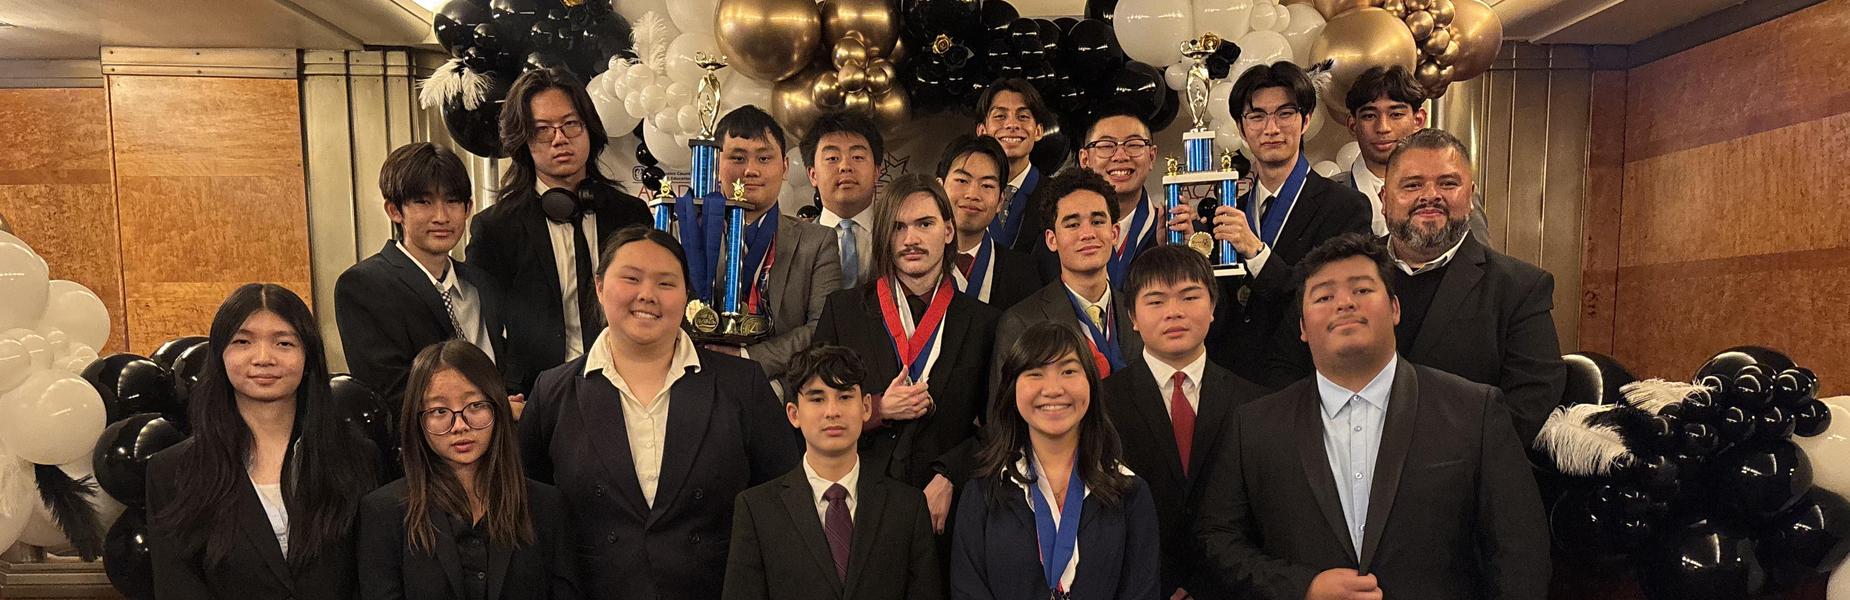
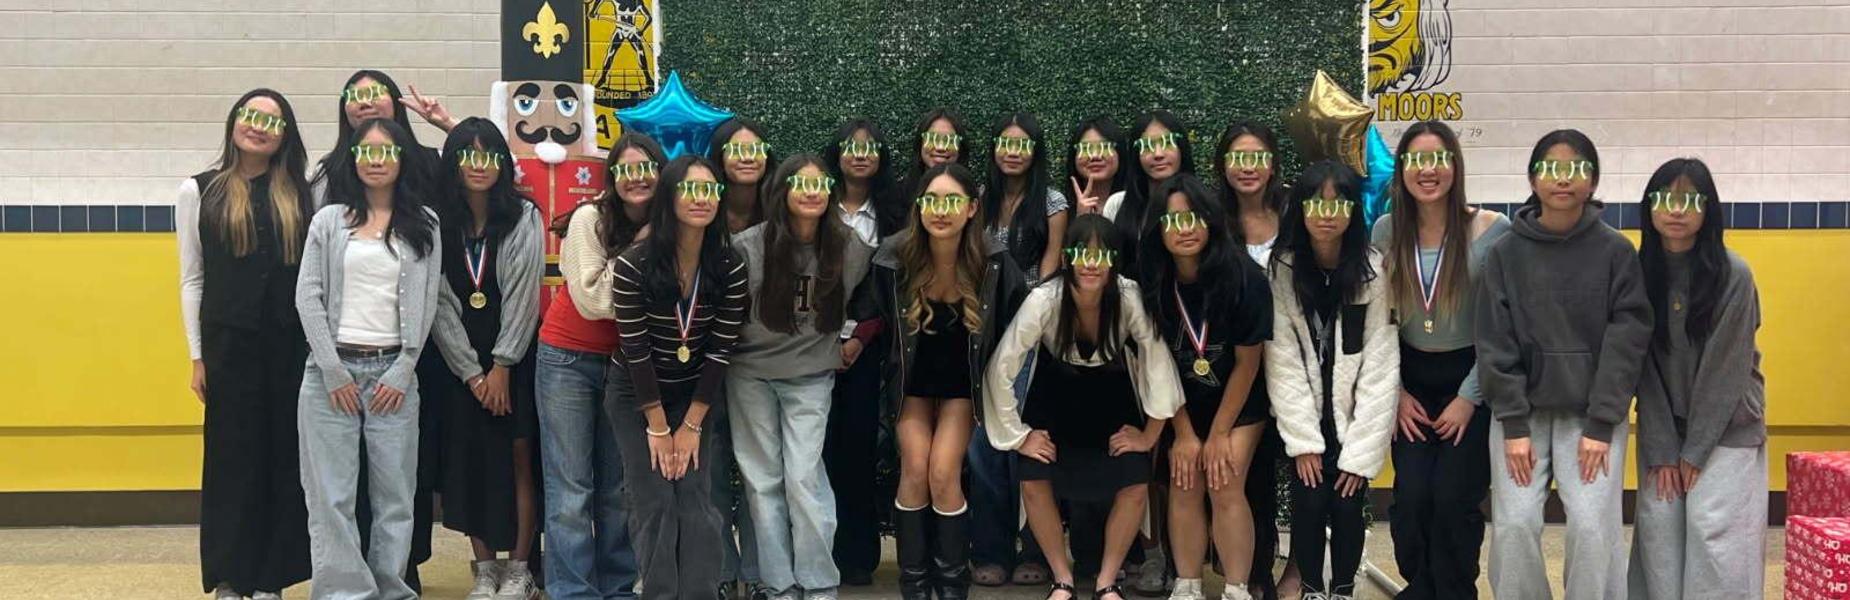
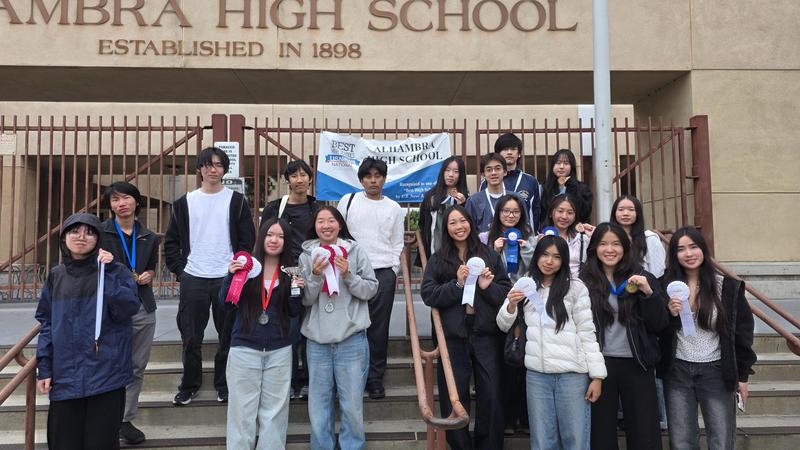
Congrats to our Acadec Team: 3x LA County Champions!
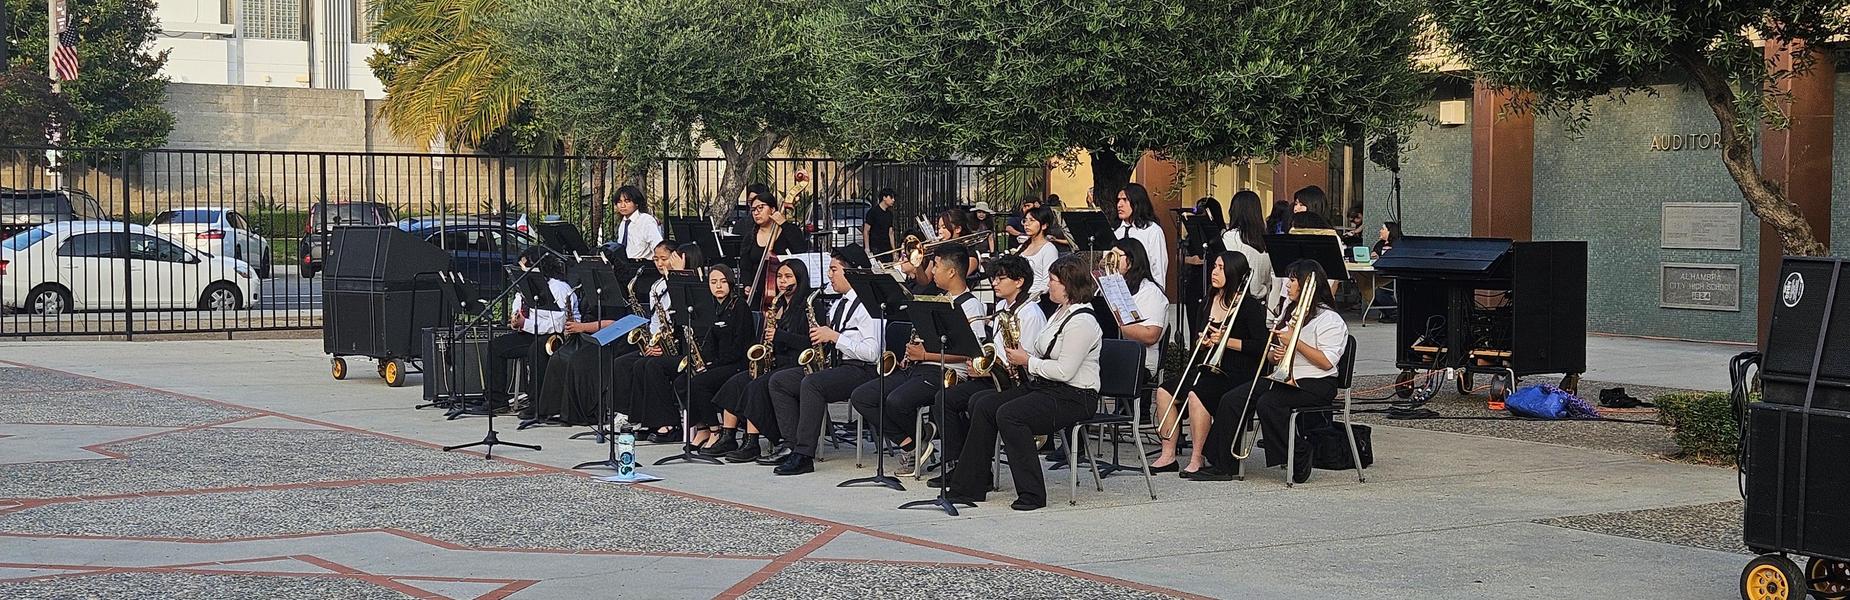
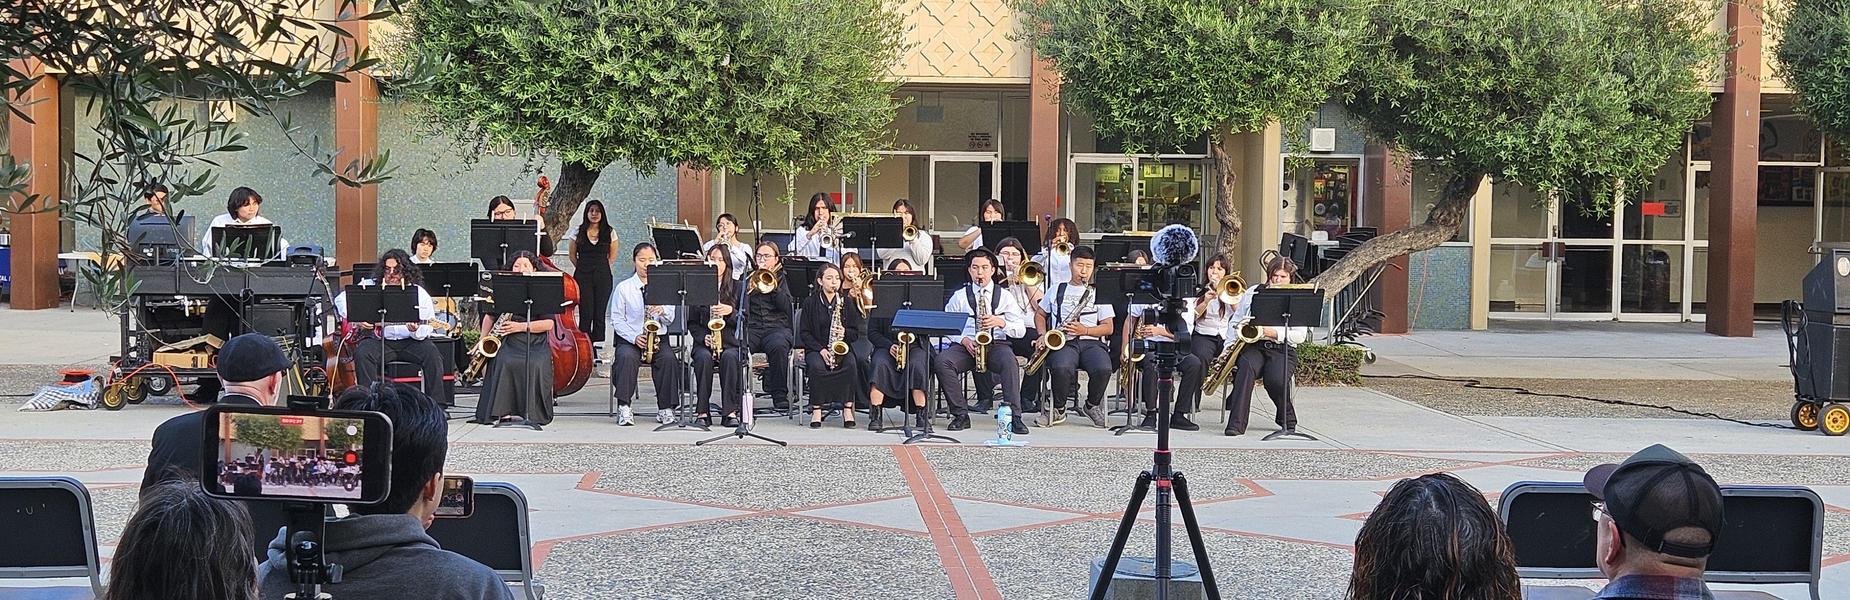
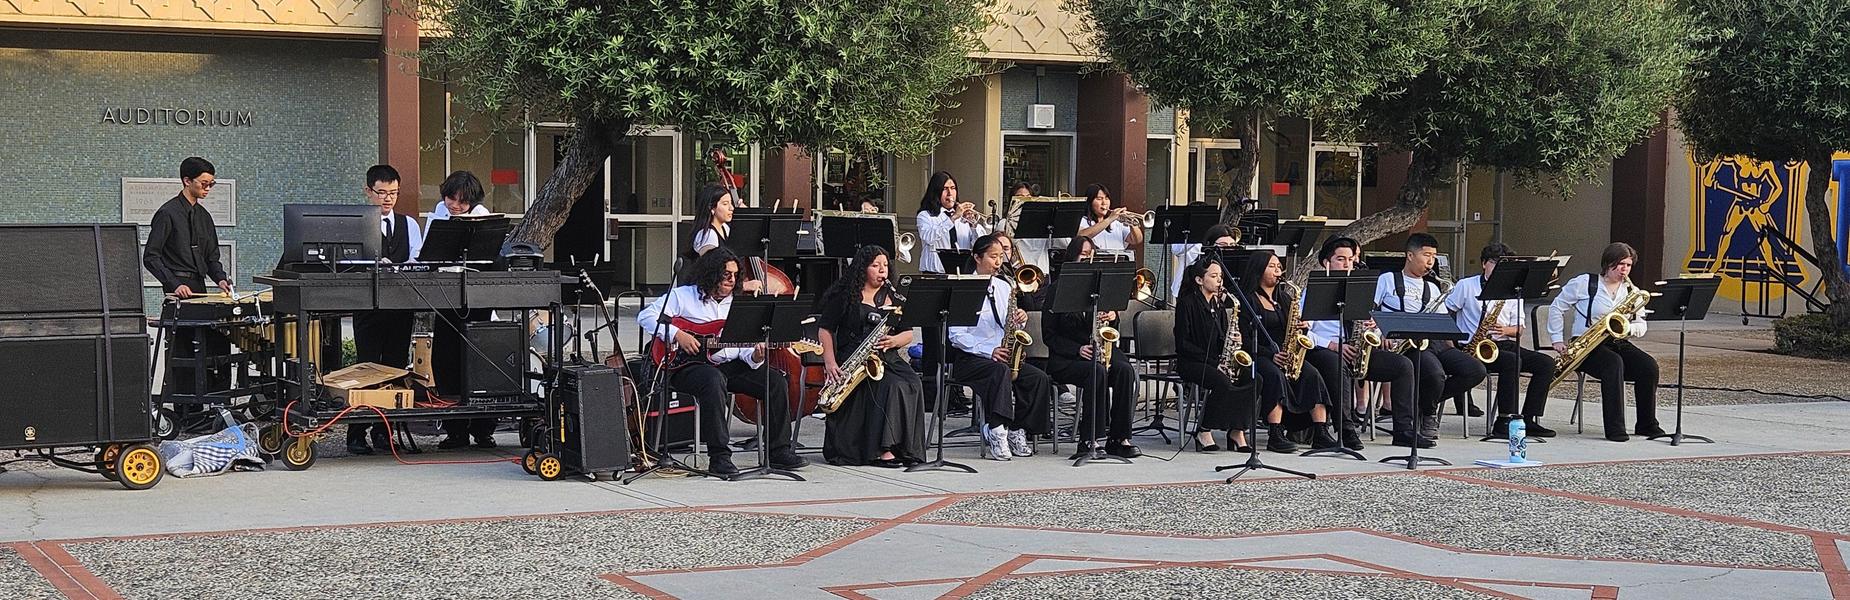
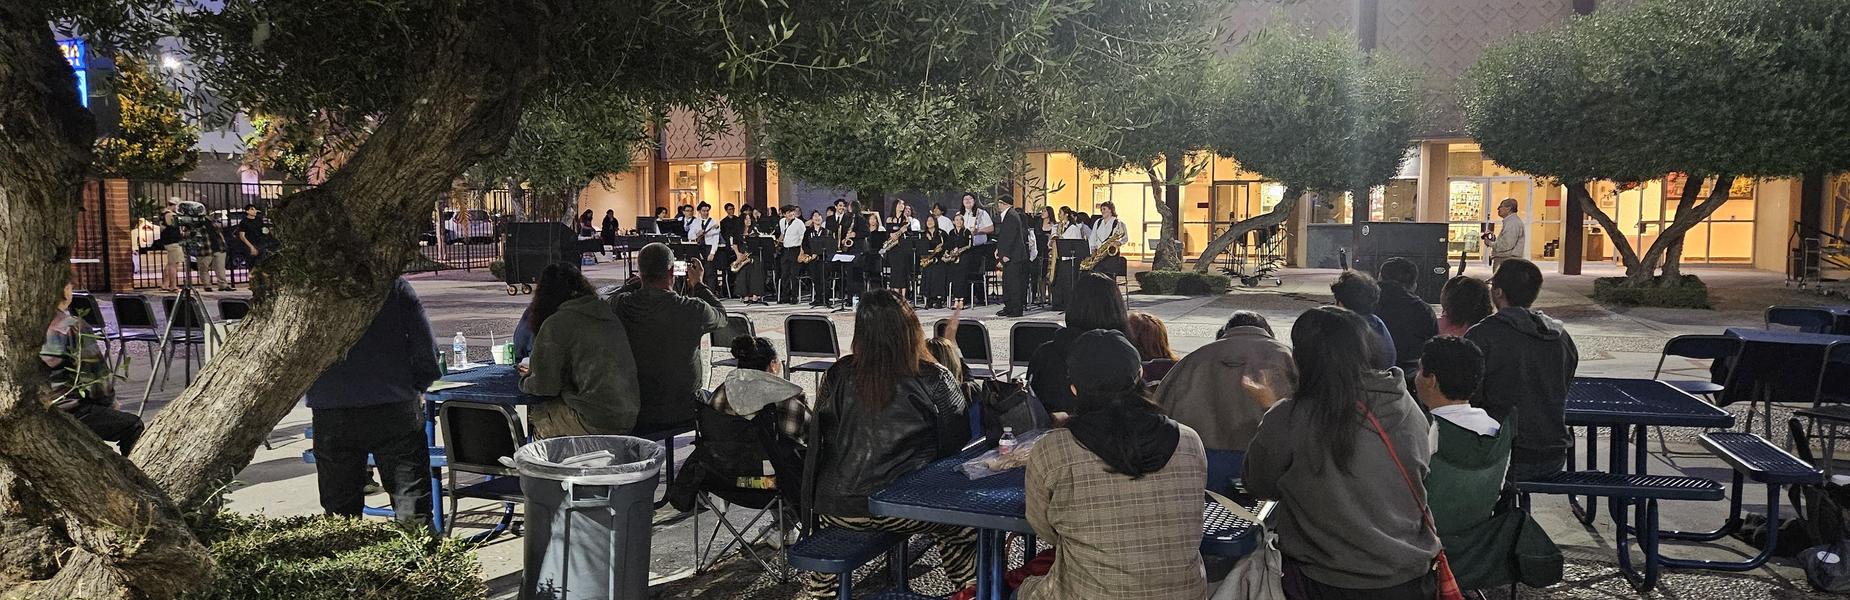
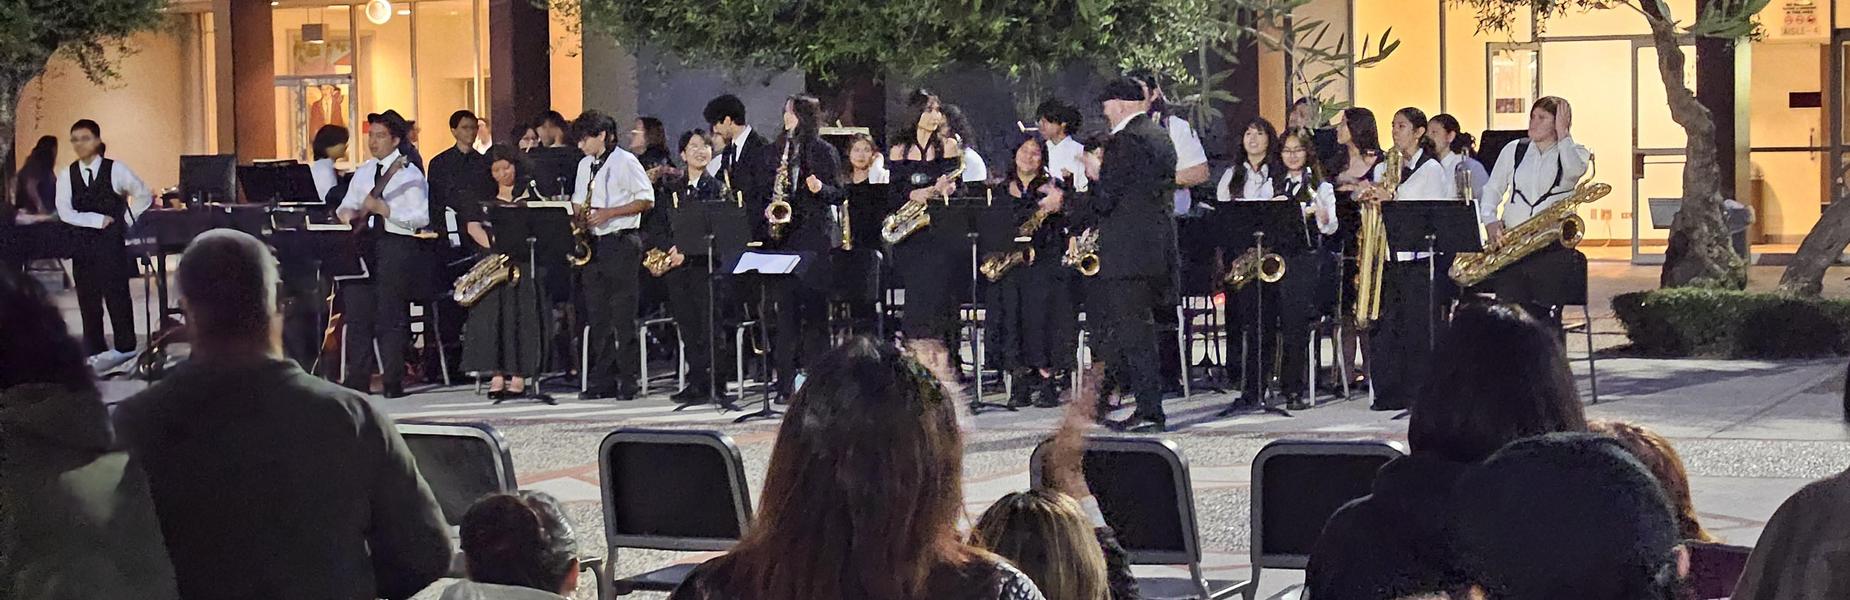
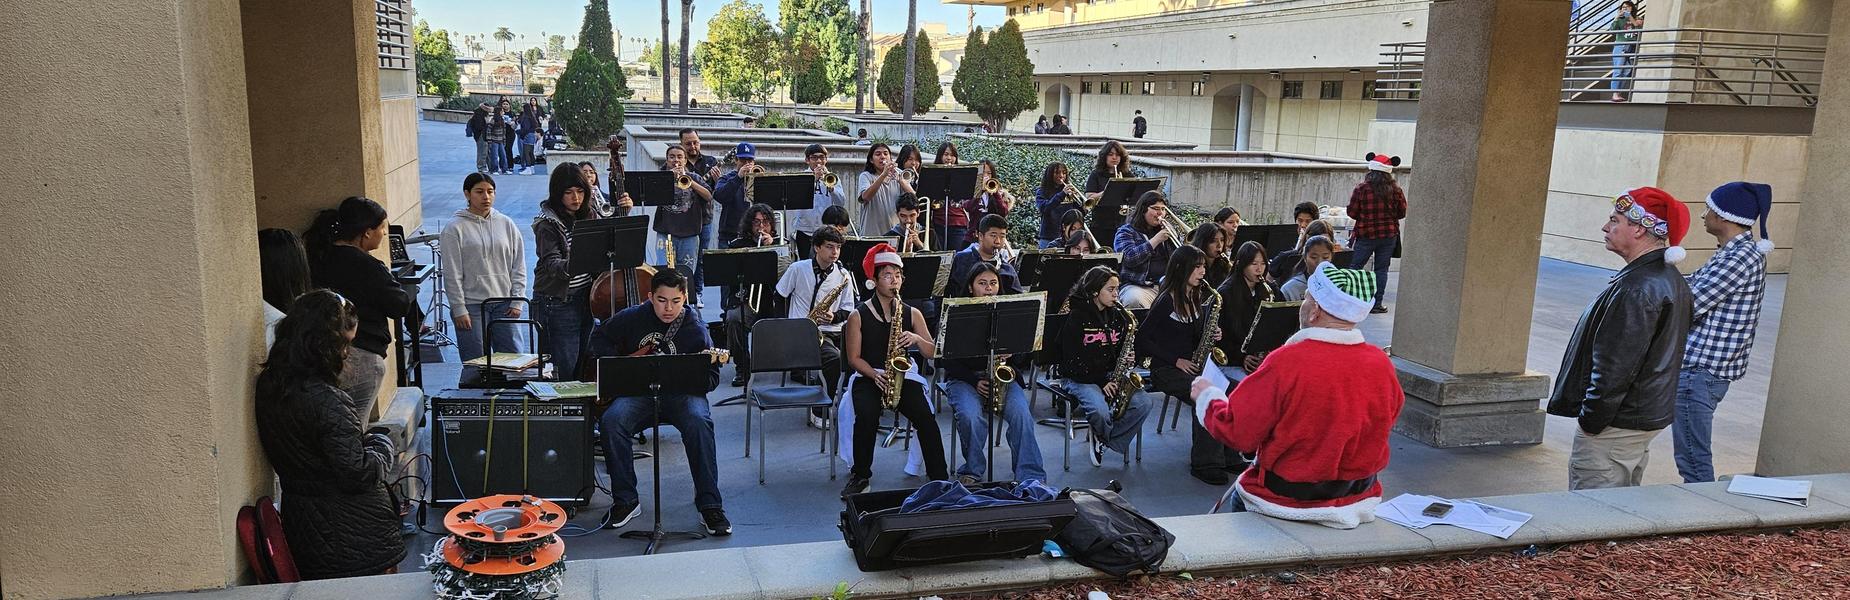
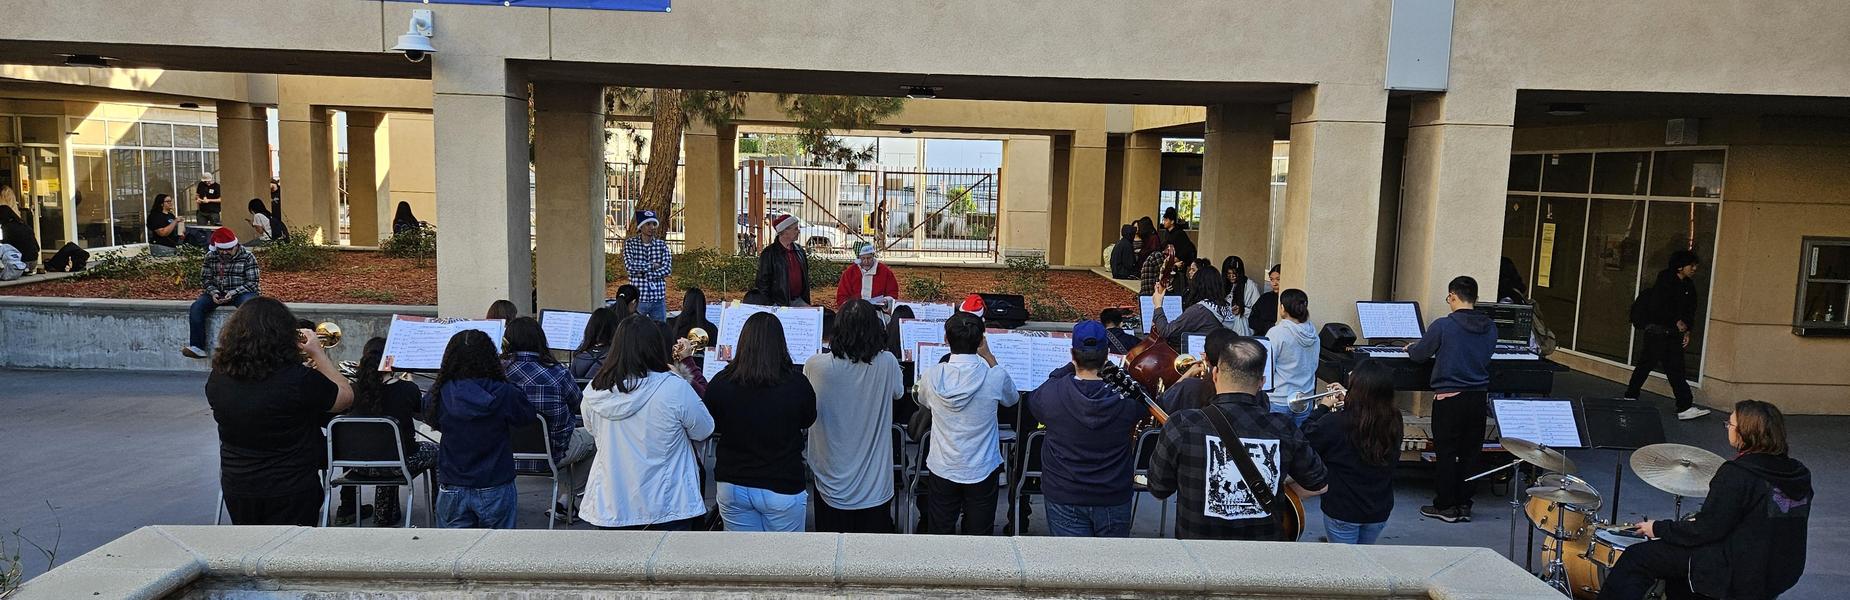
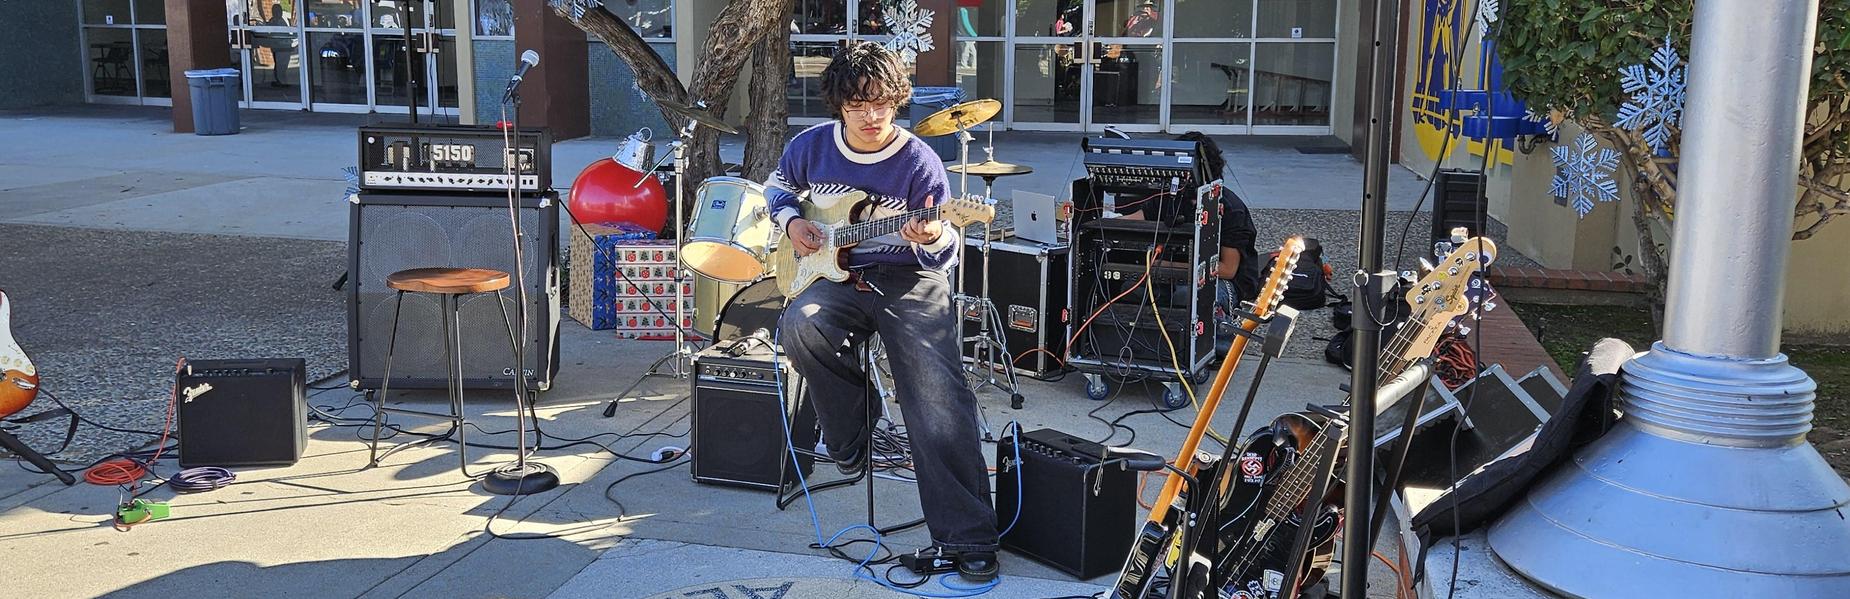
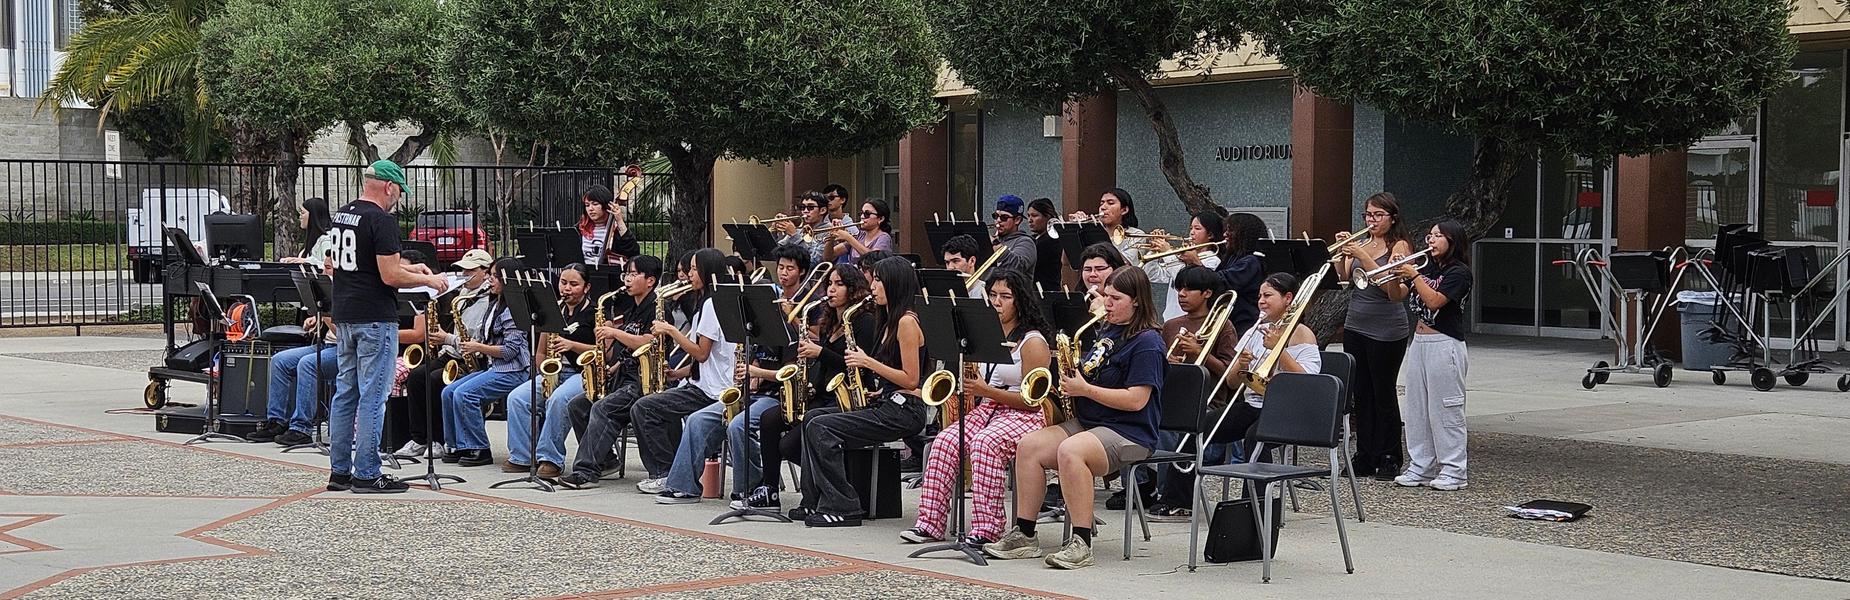
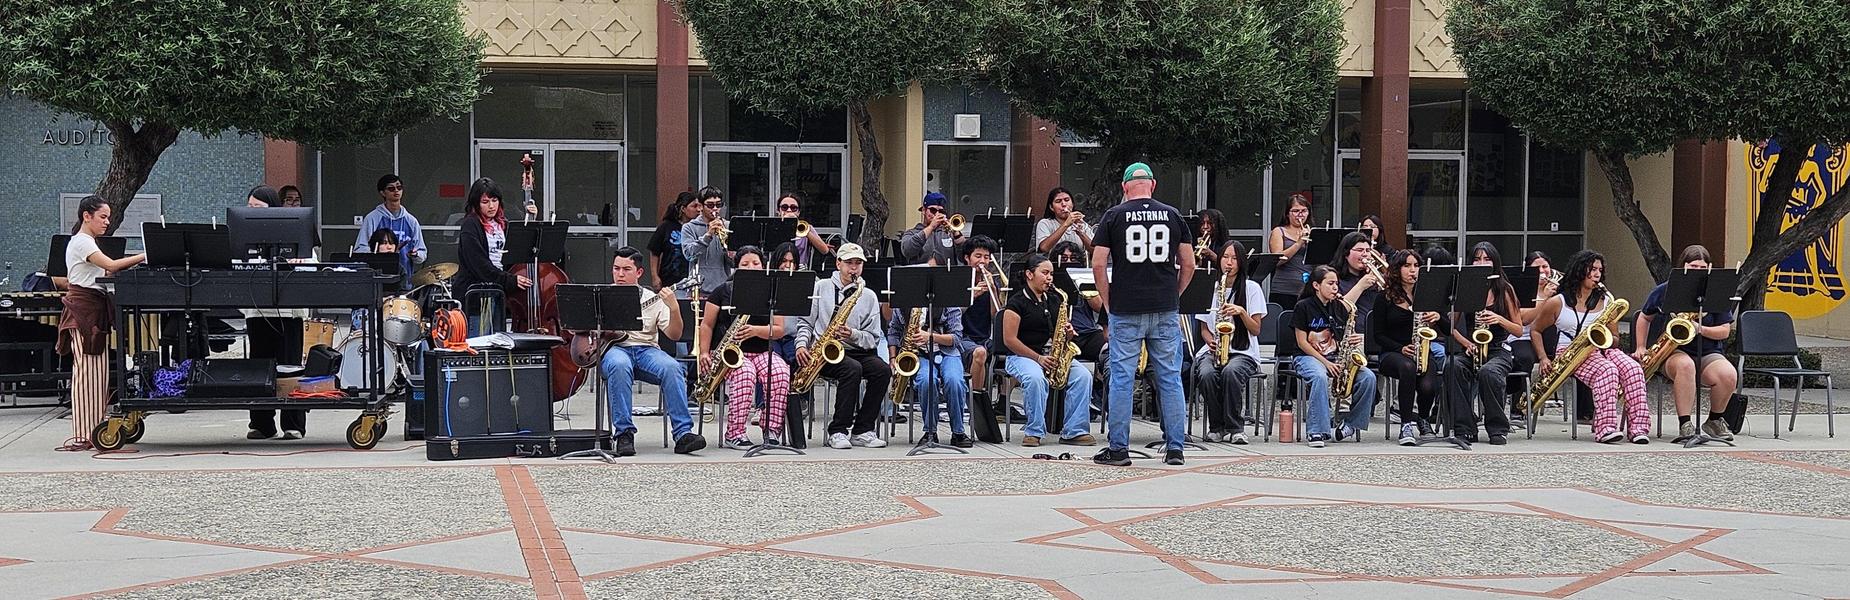
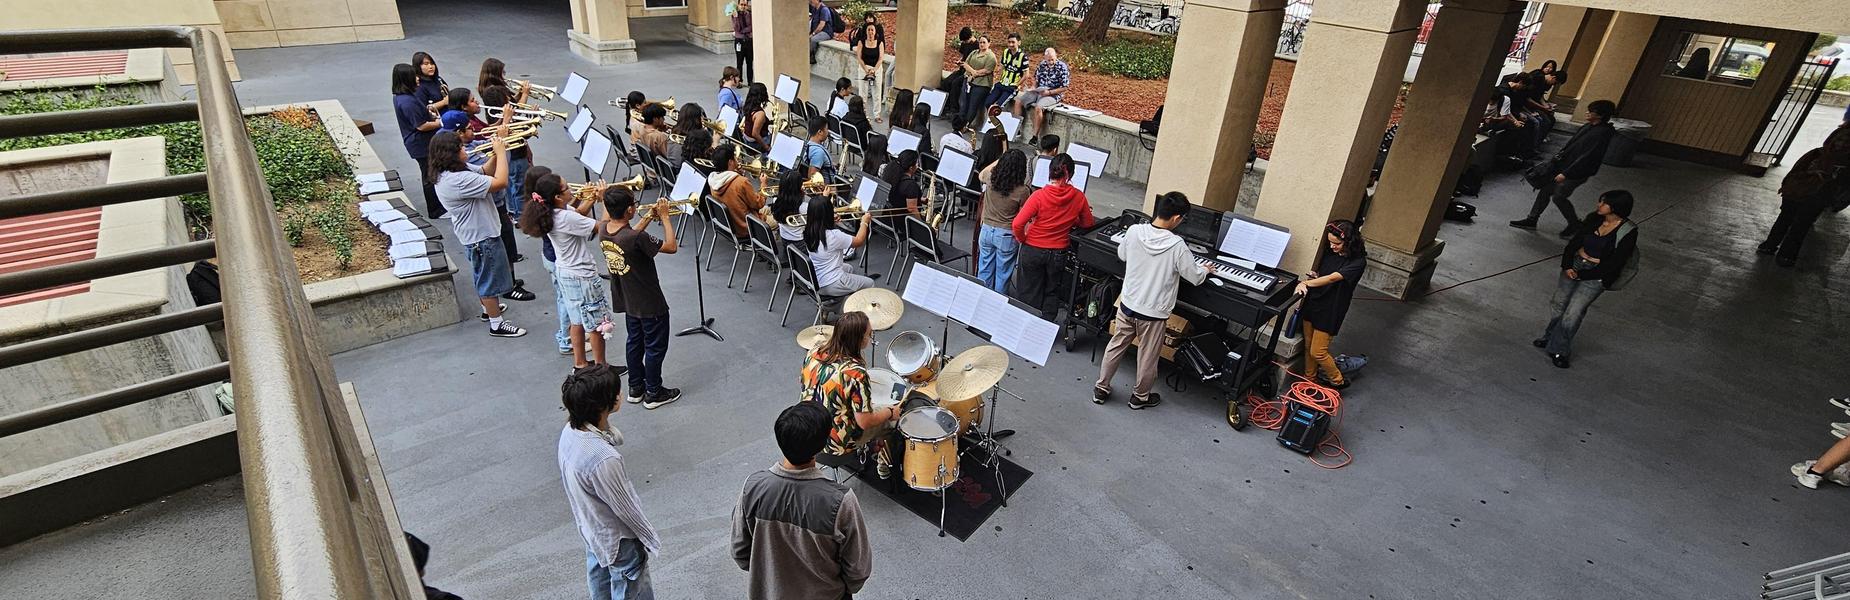
Jazz Band Spring Concert
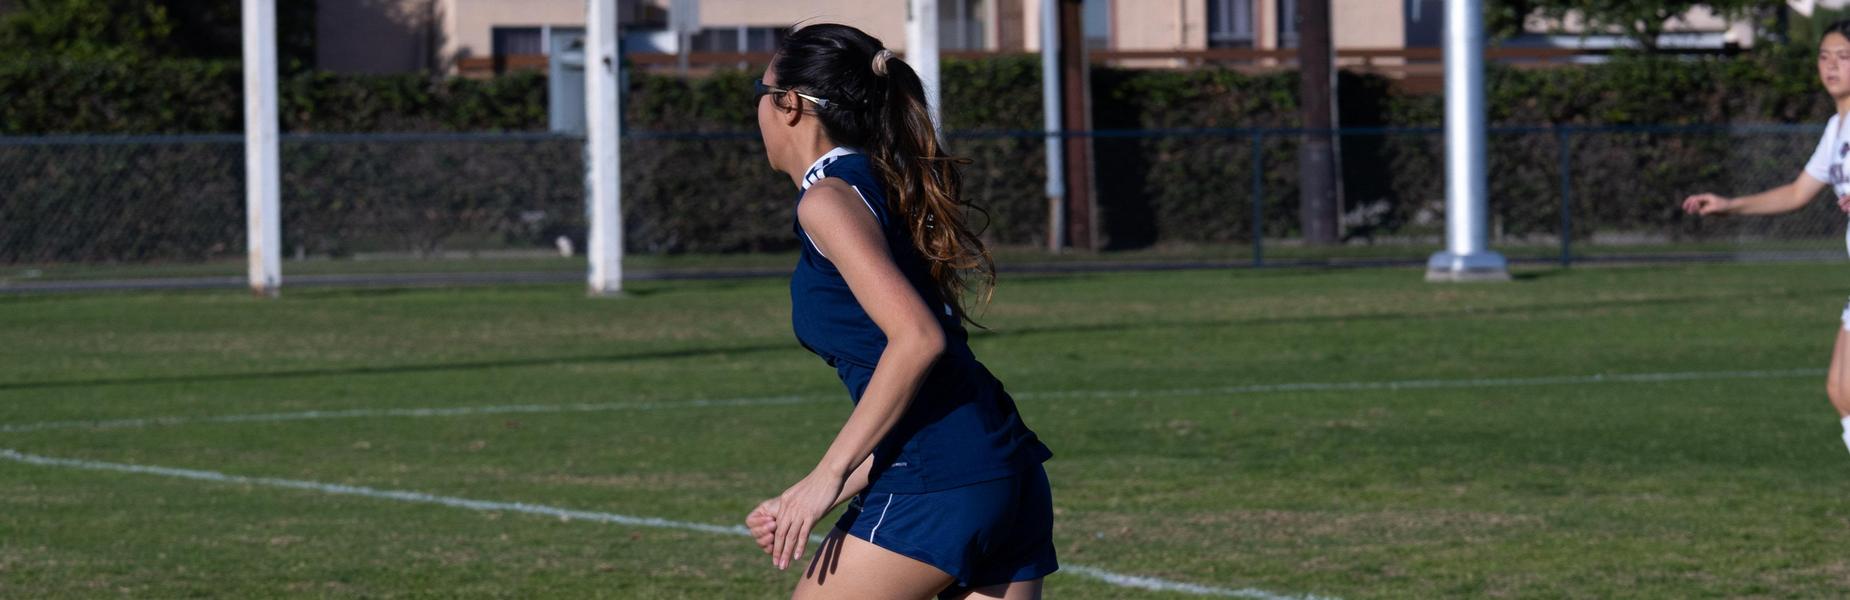
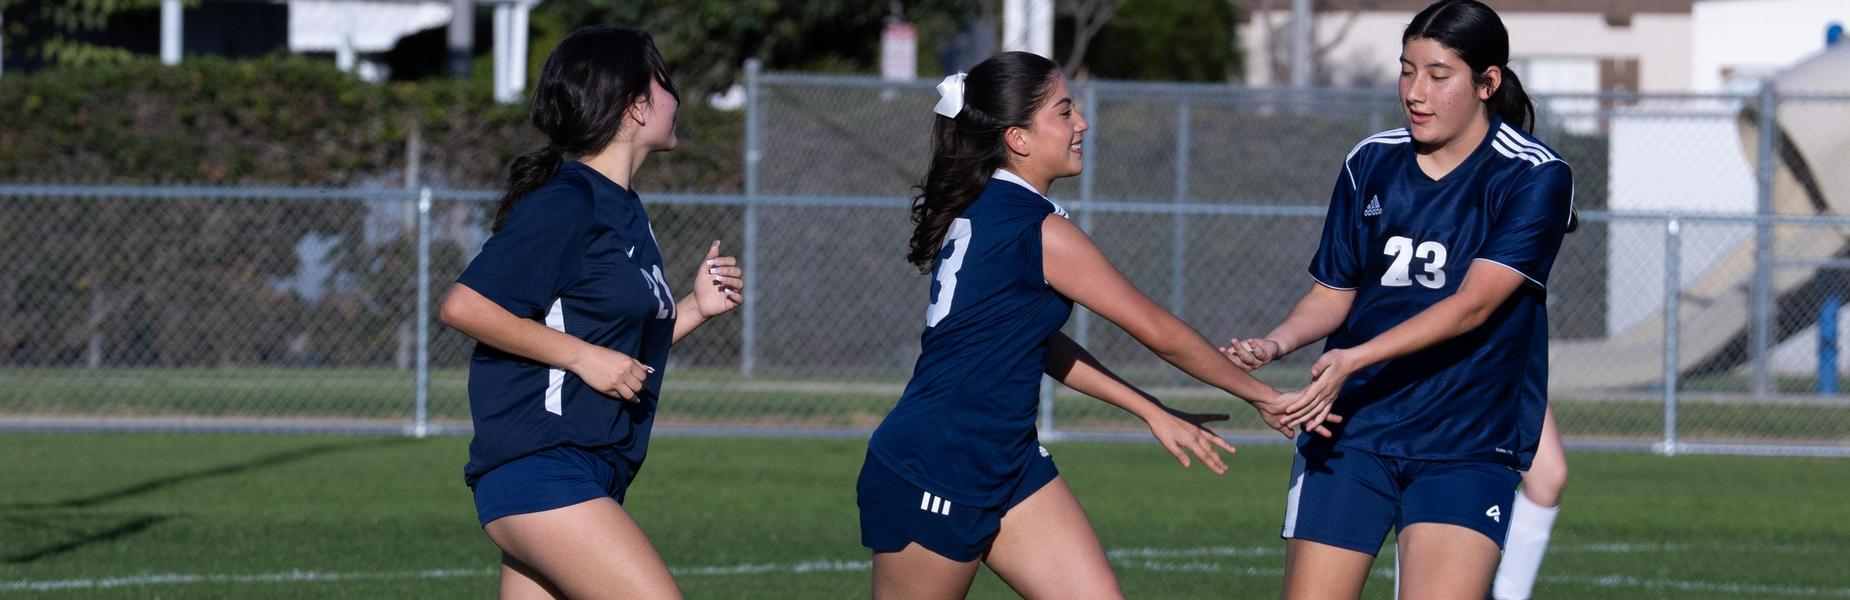
Girls Soccer Banquet
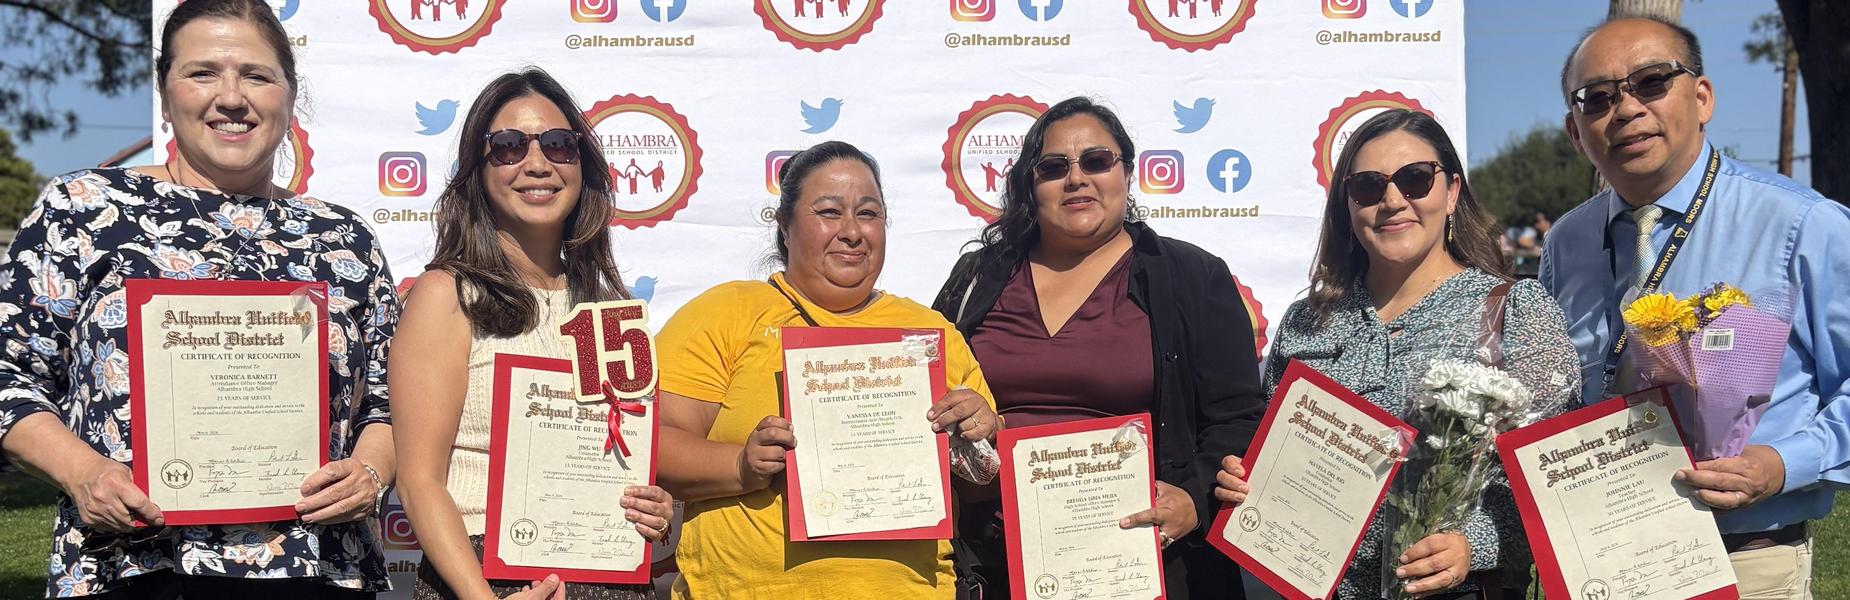
Congrats to our longevity educators!
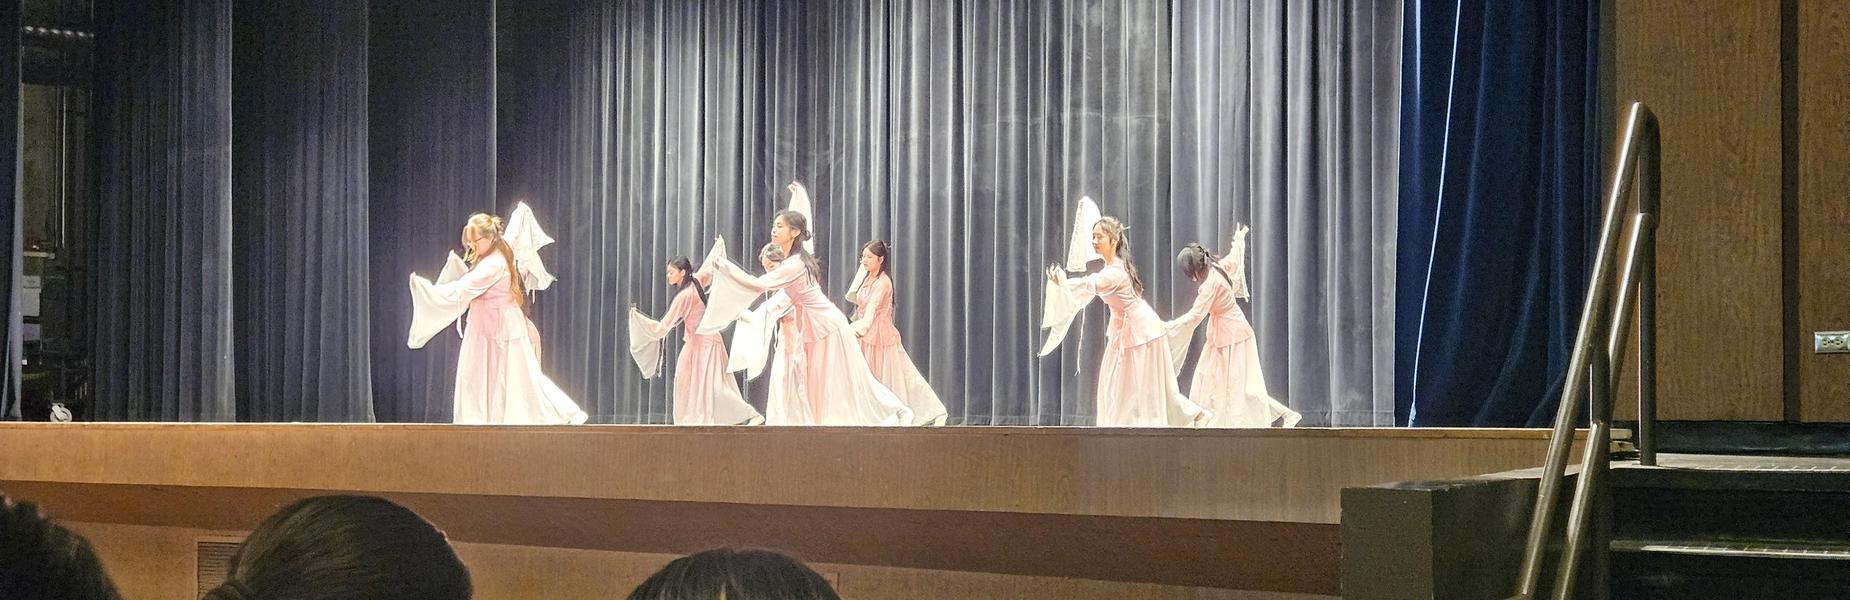
Chinese Heritage Dancers perform at the last assembly.
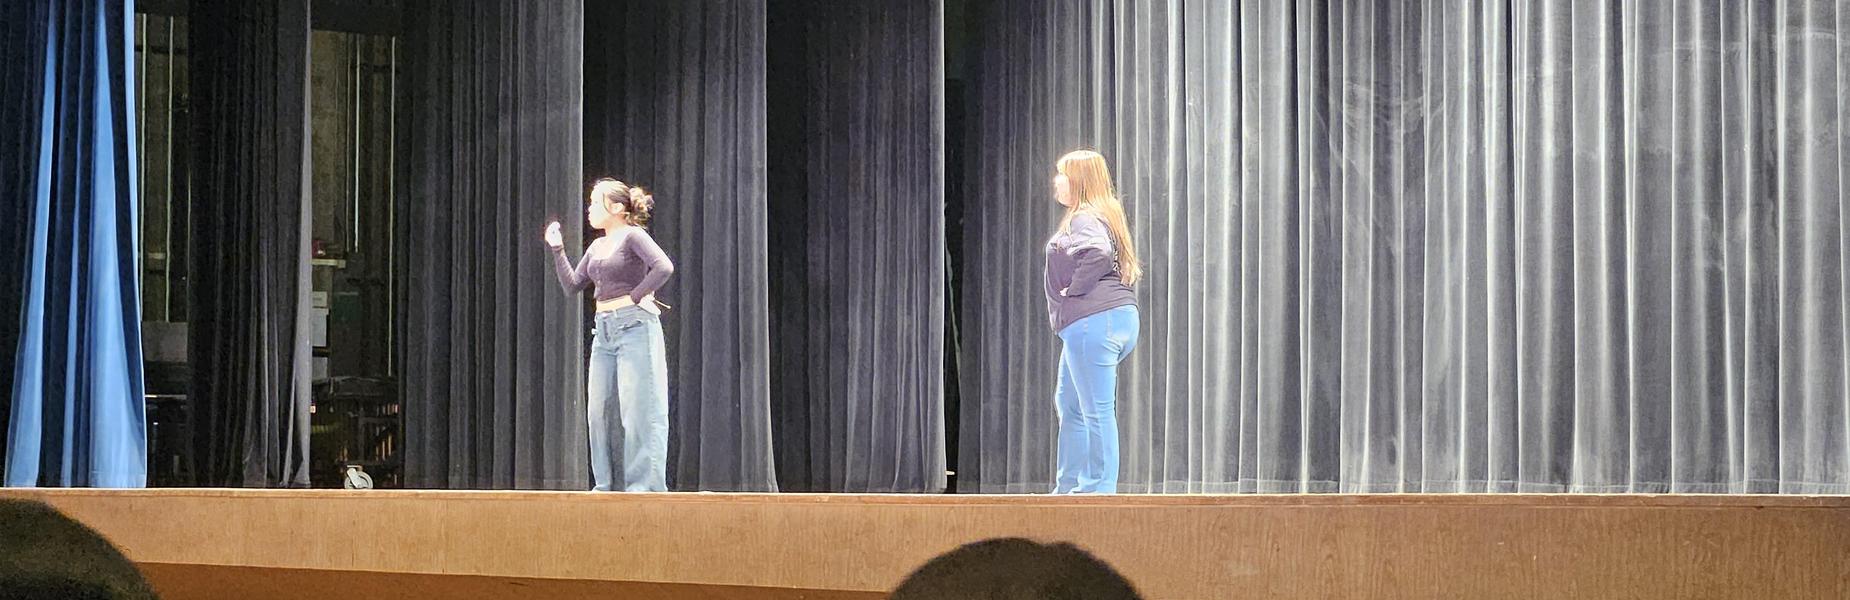
Thespians perform at the last assembly
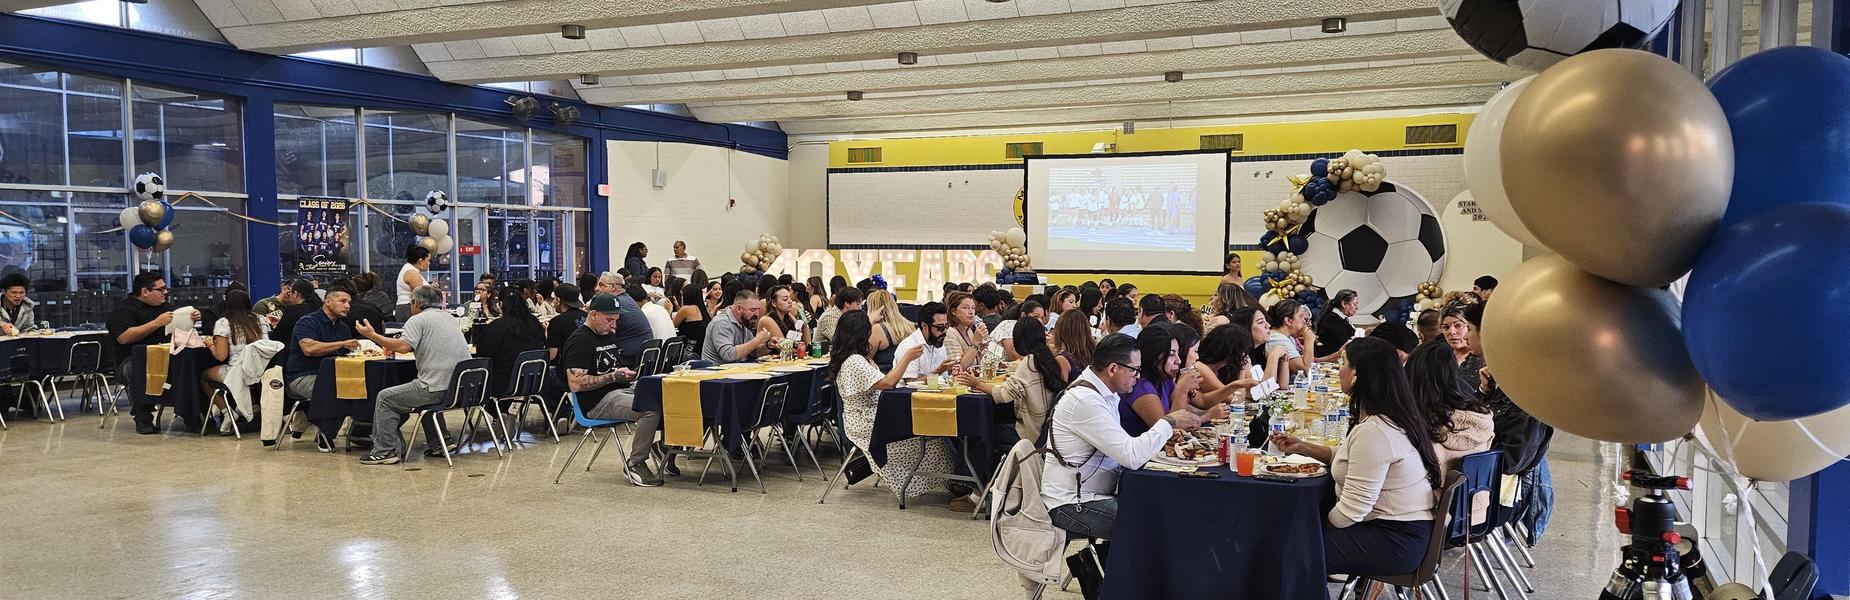
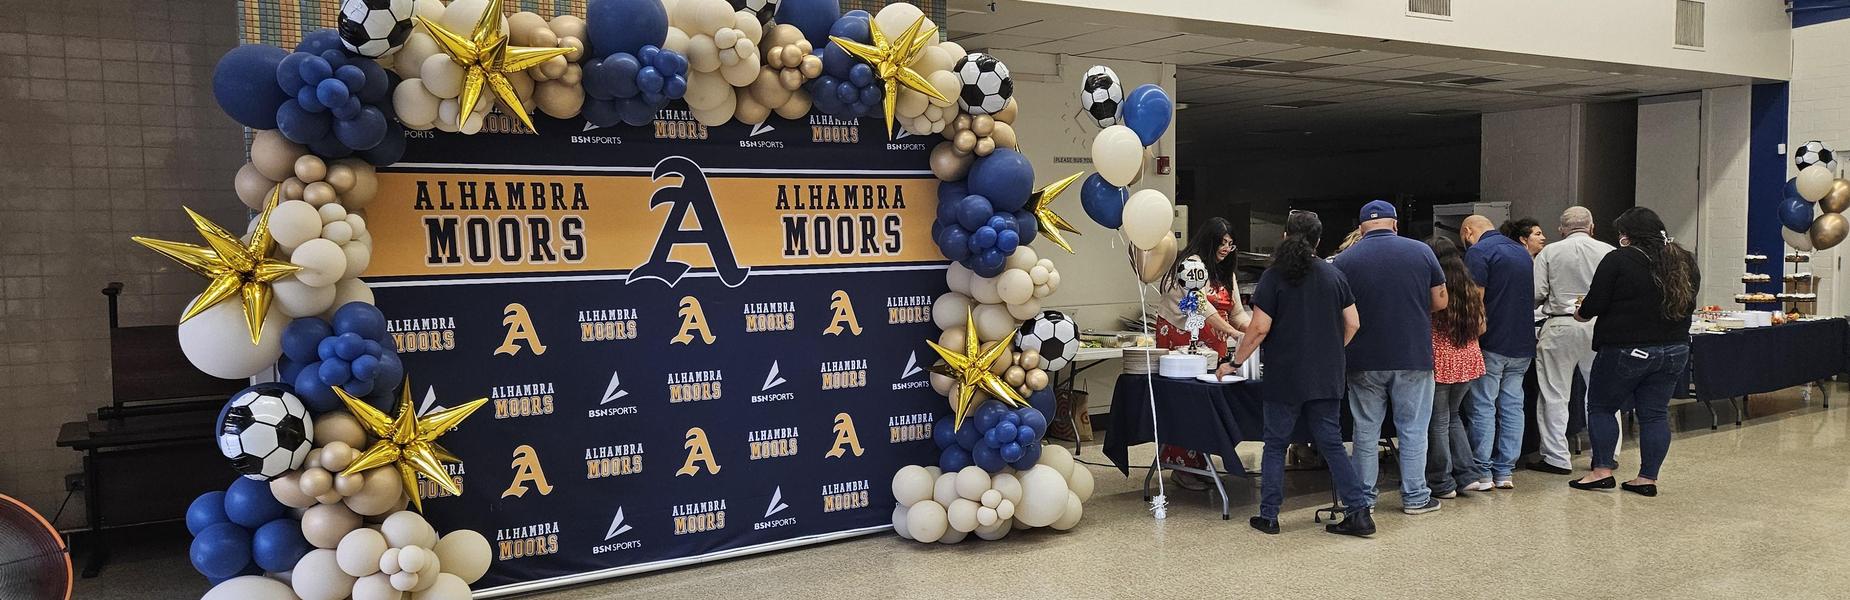
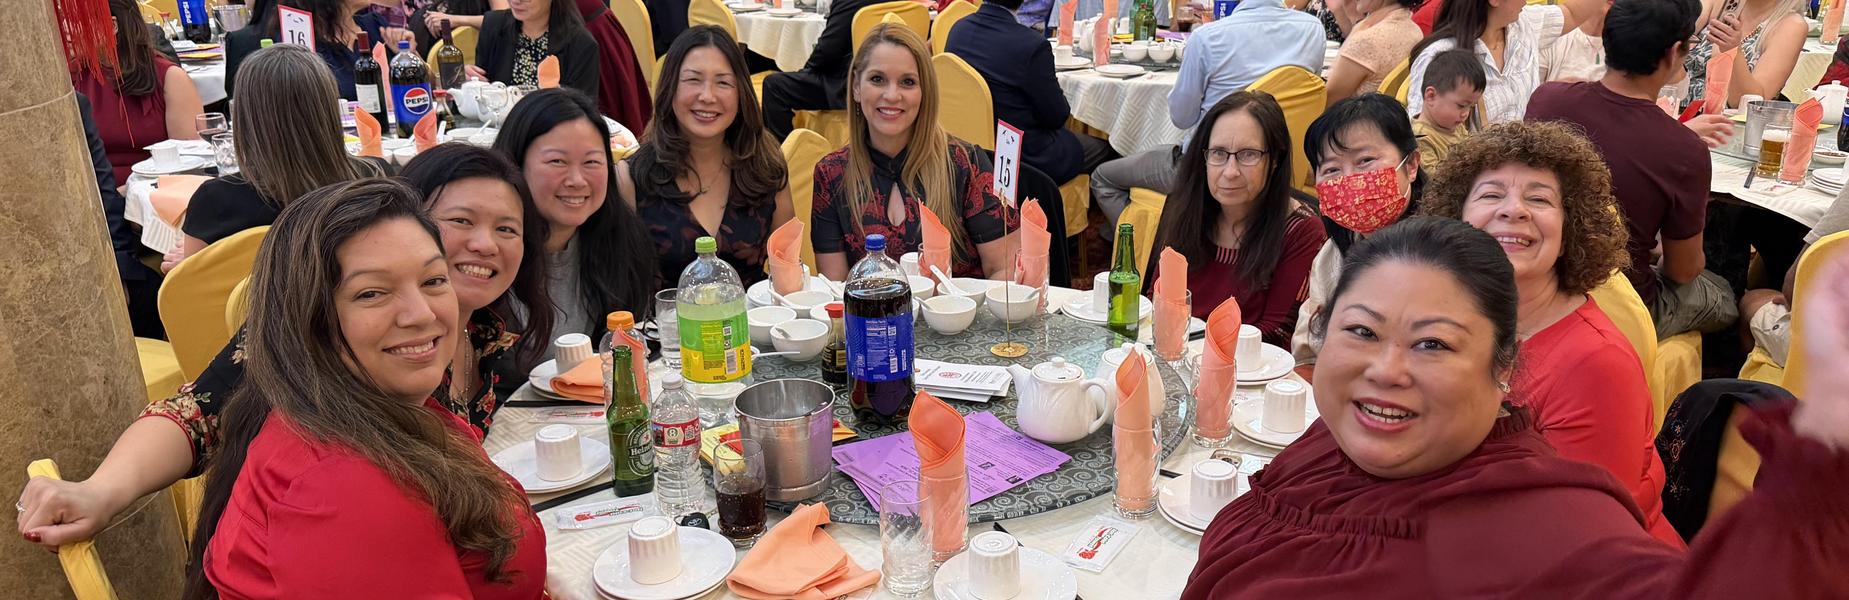
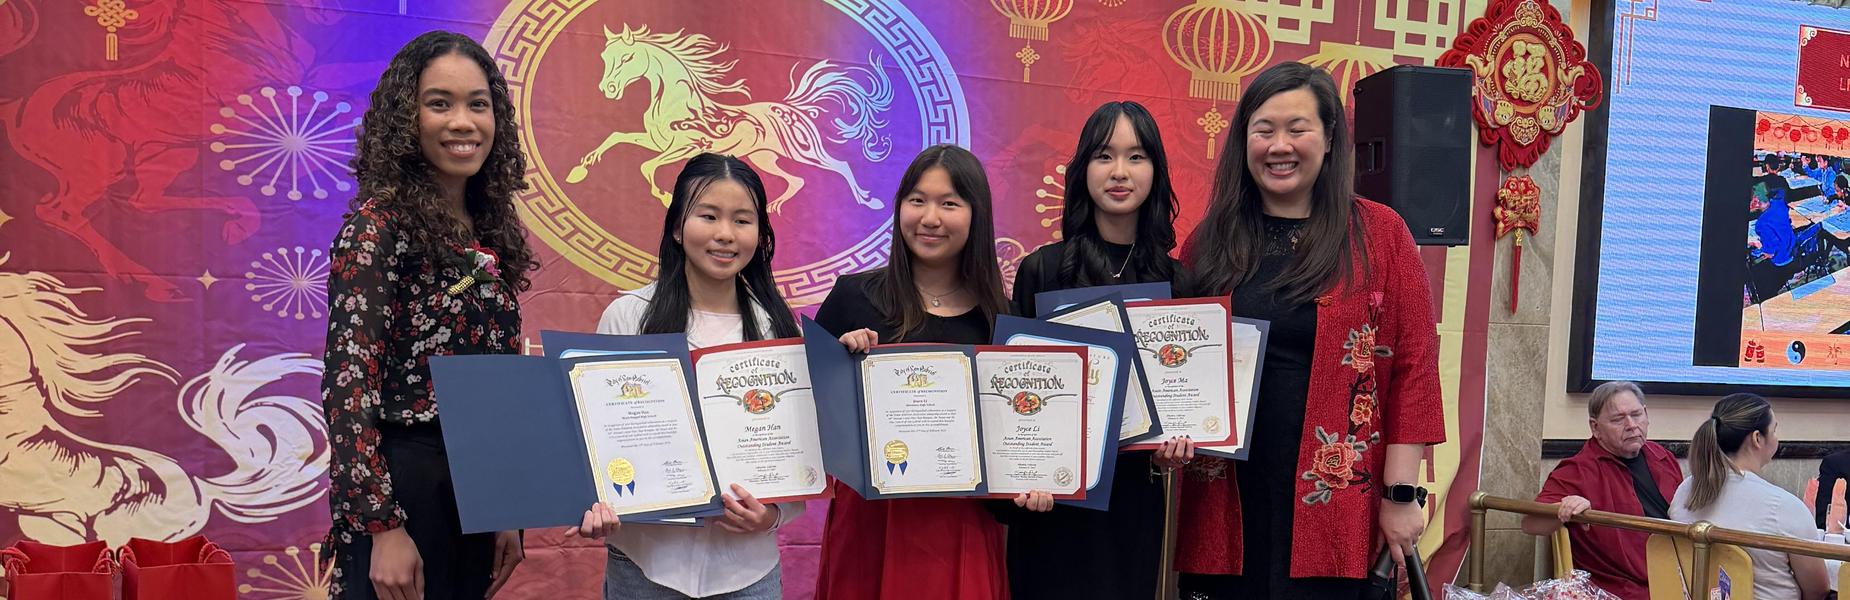
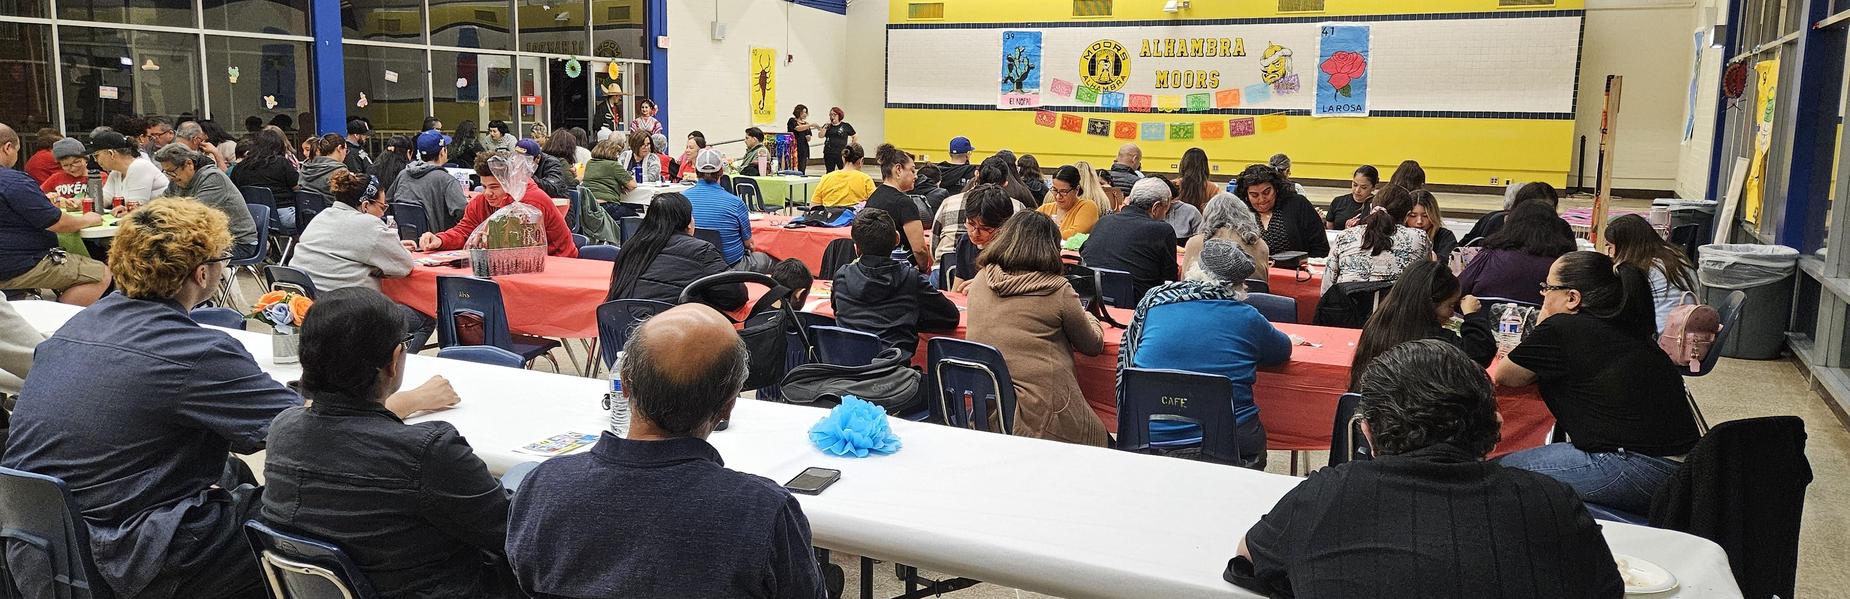
ALA Banquet 2026
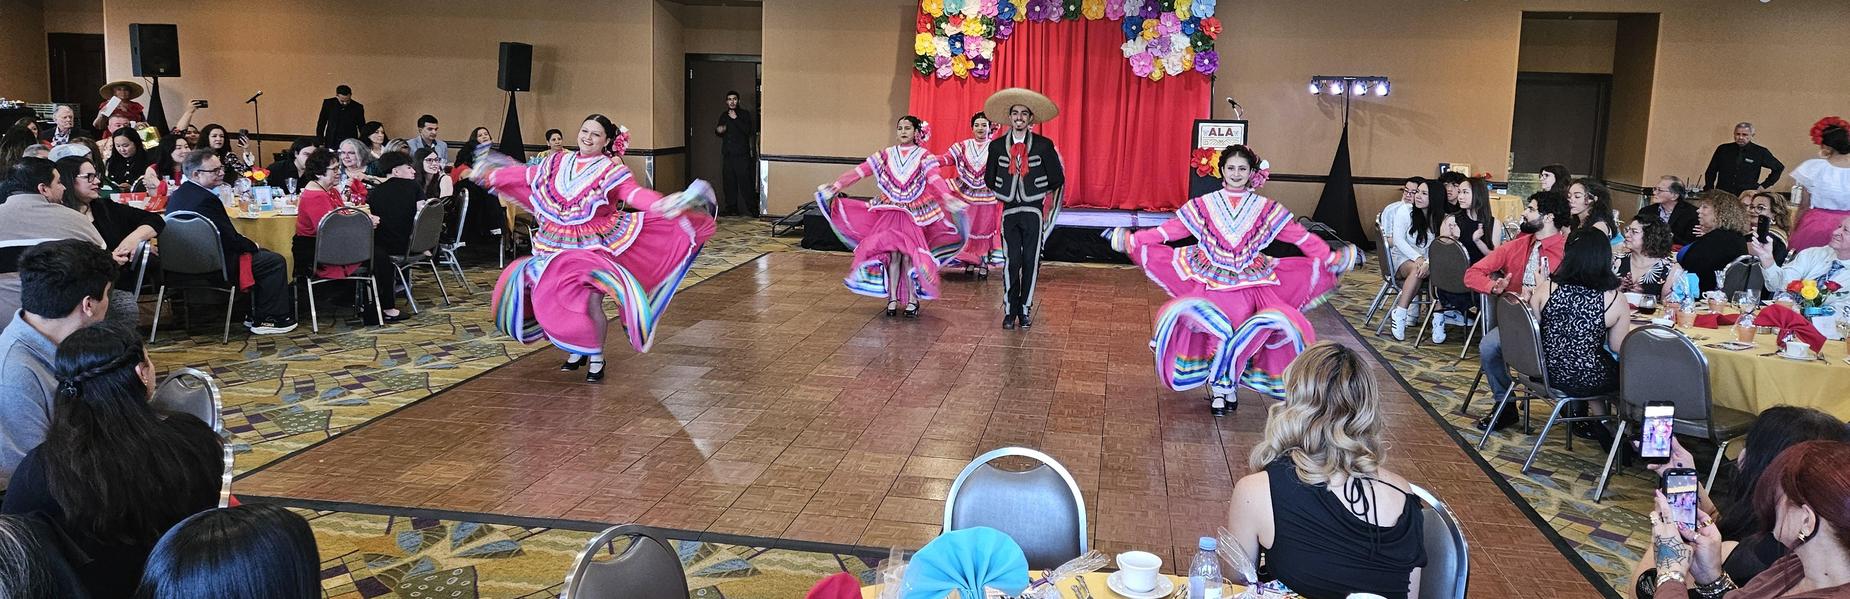
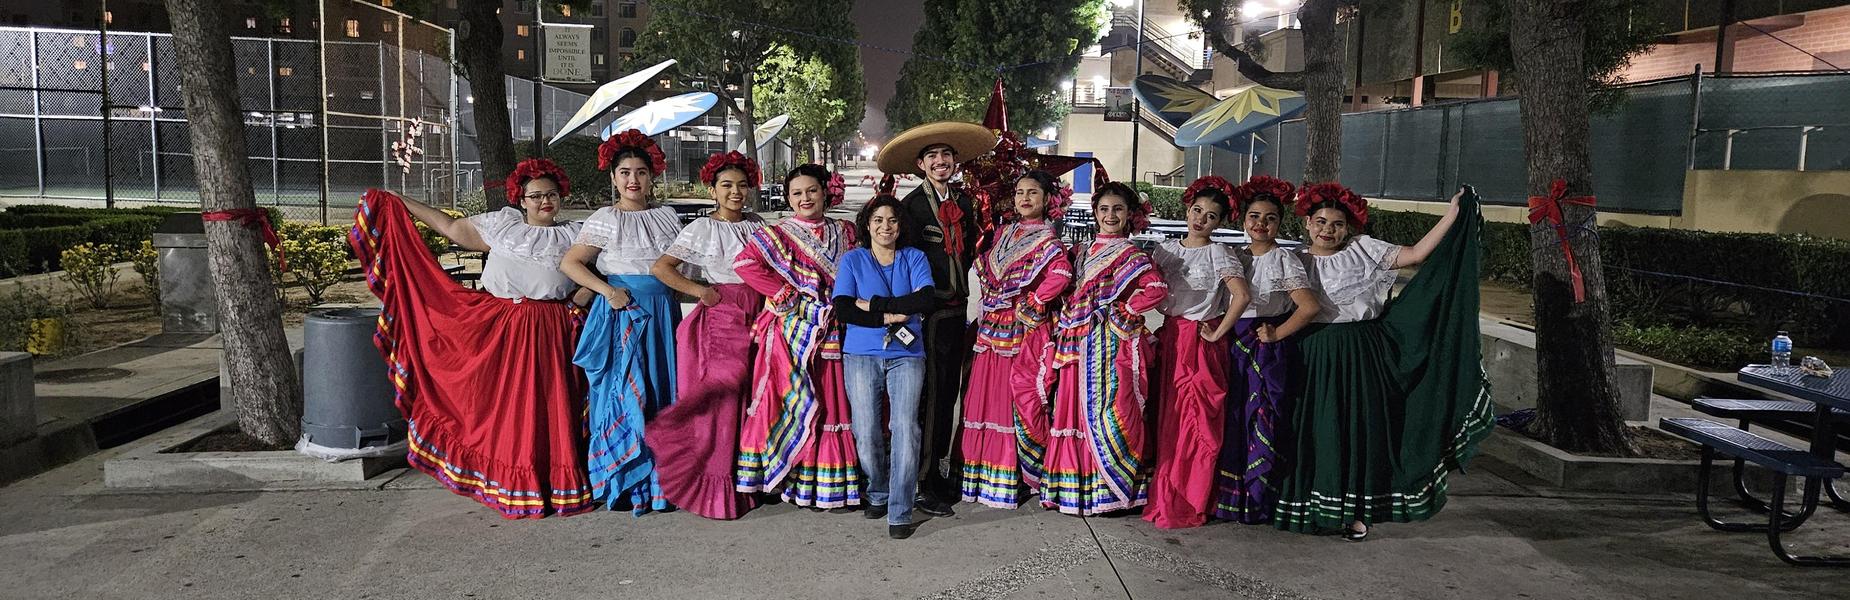
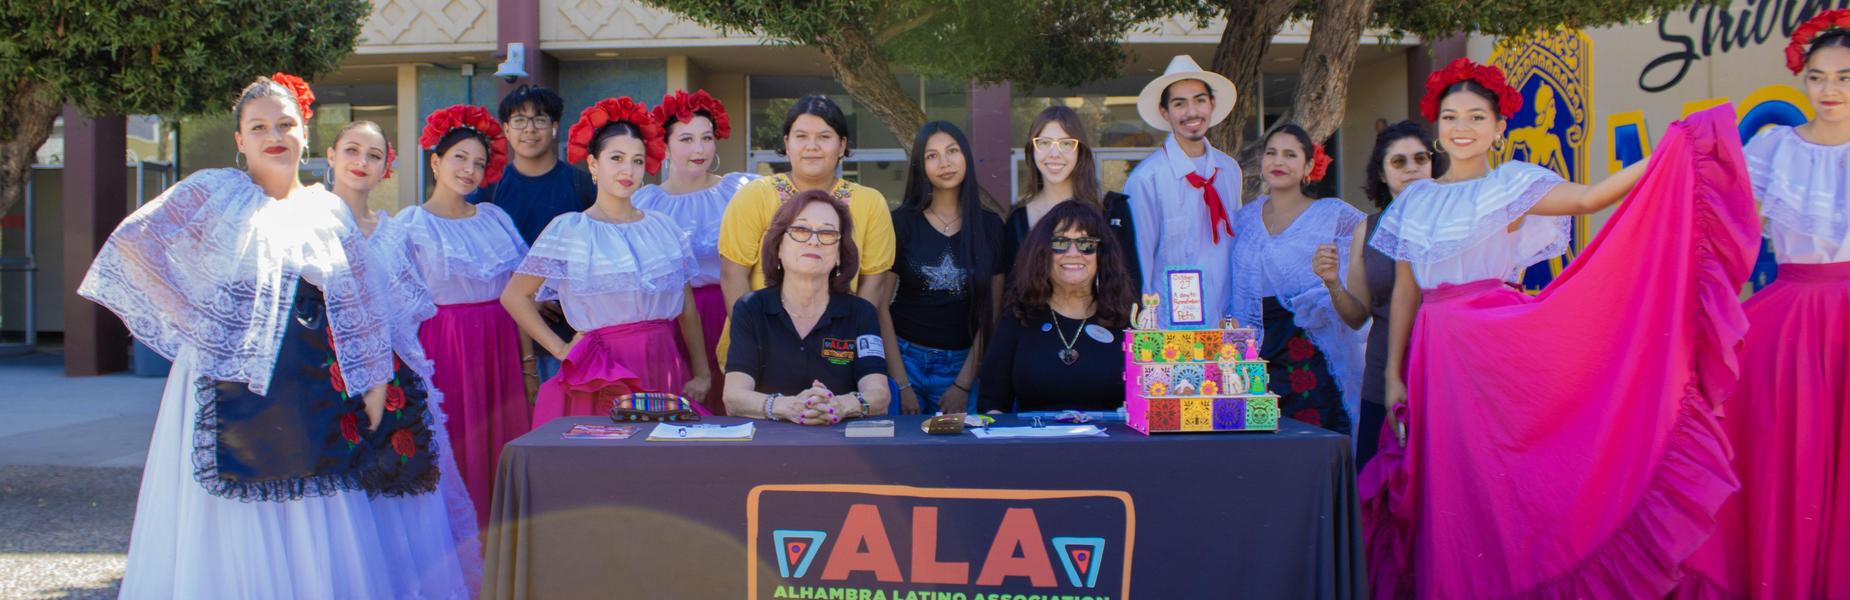
ALA Banquet Sandra Saavedra and Folklorico
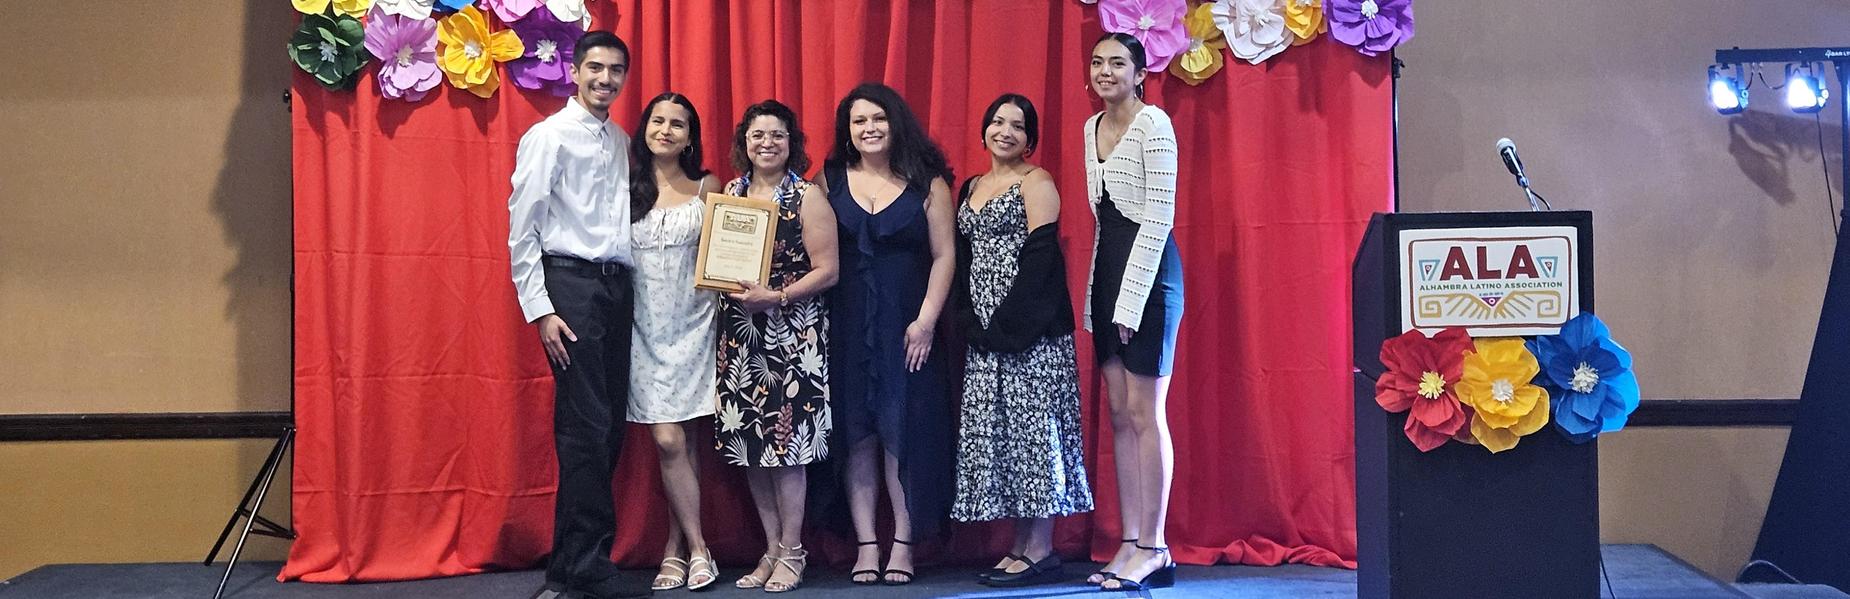
ALA Banquet 2026 Awardees
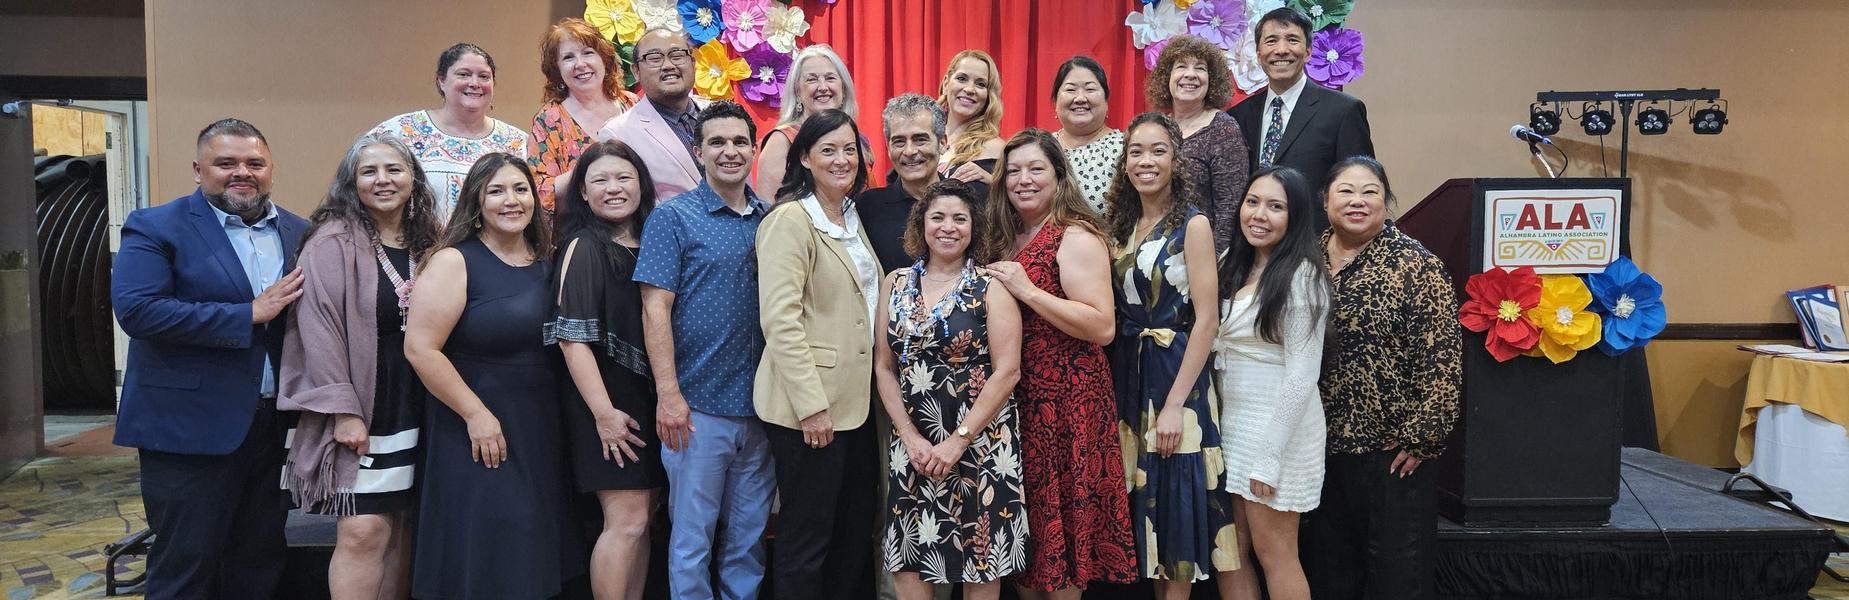
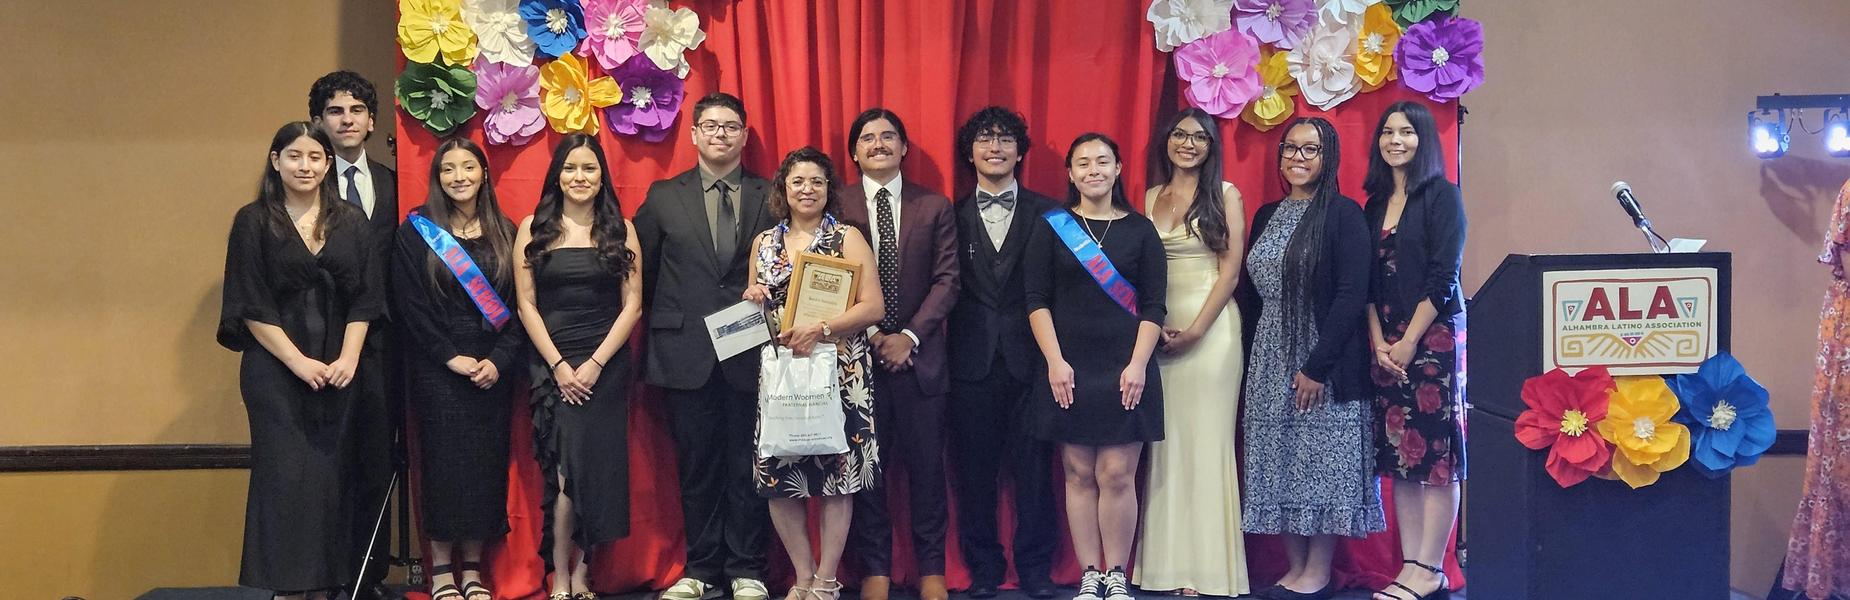
ALA Banquet 2026 Alhambra HS Staff and Students
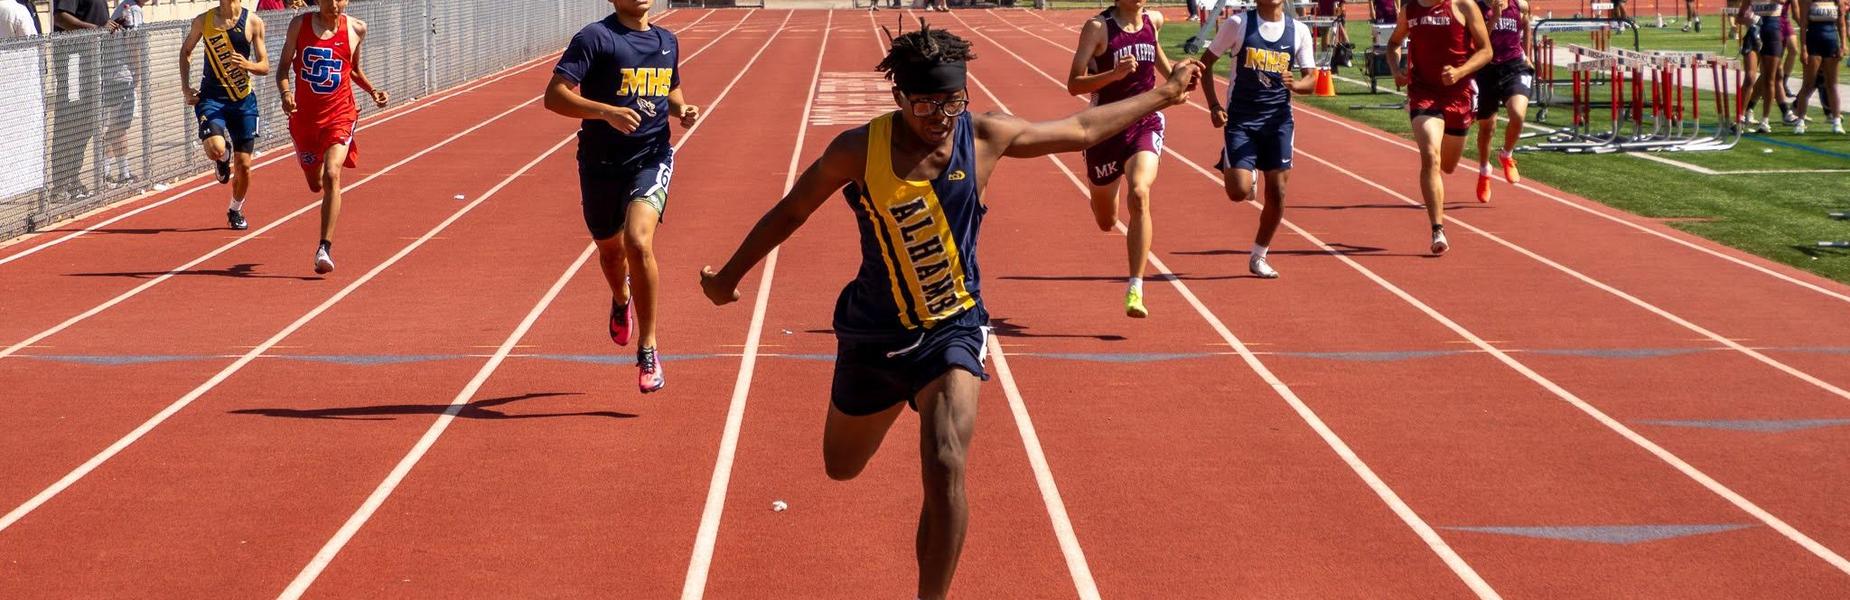
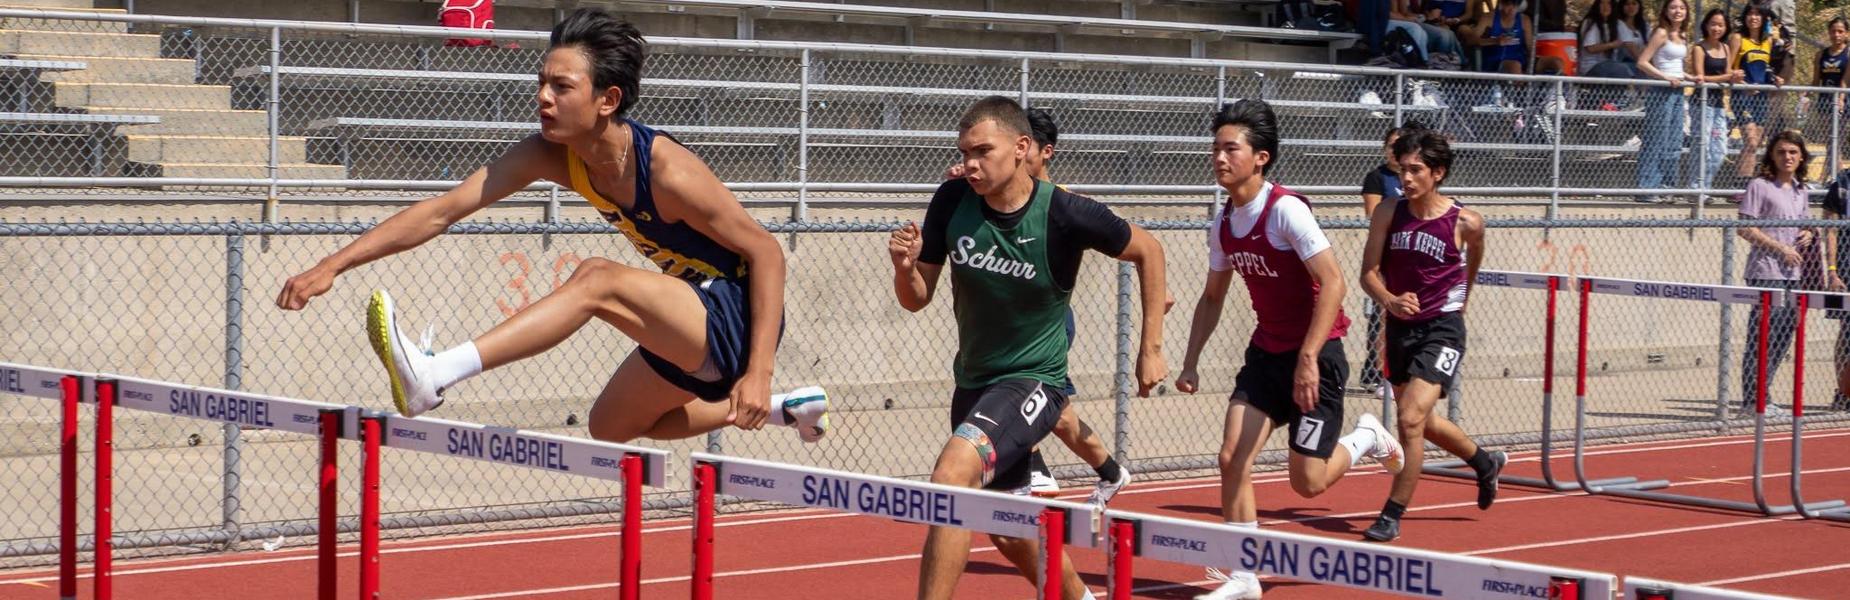
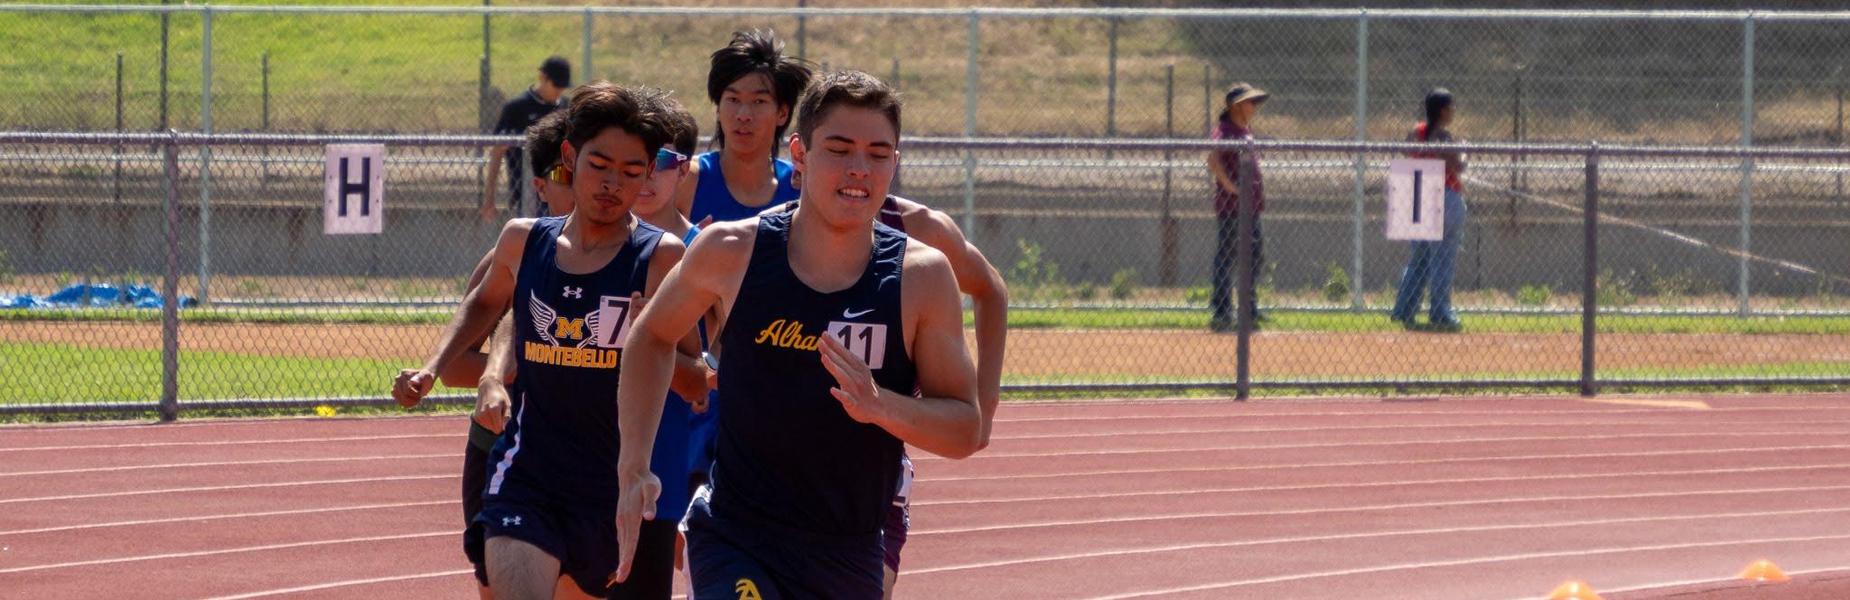
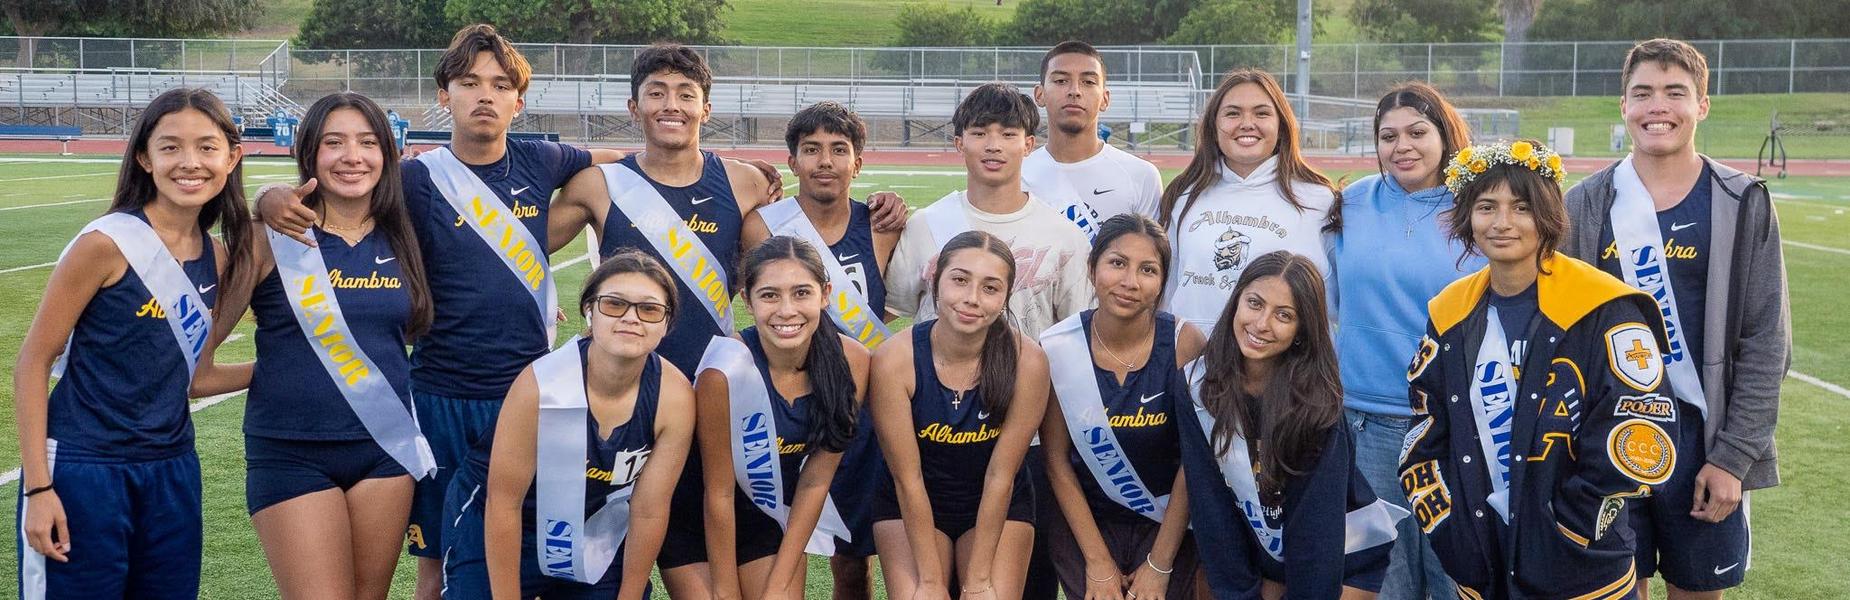
Track and Field Senior Night
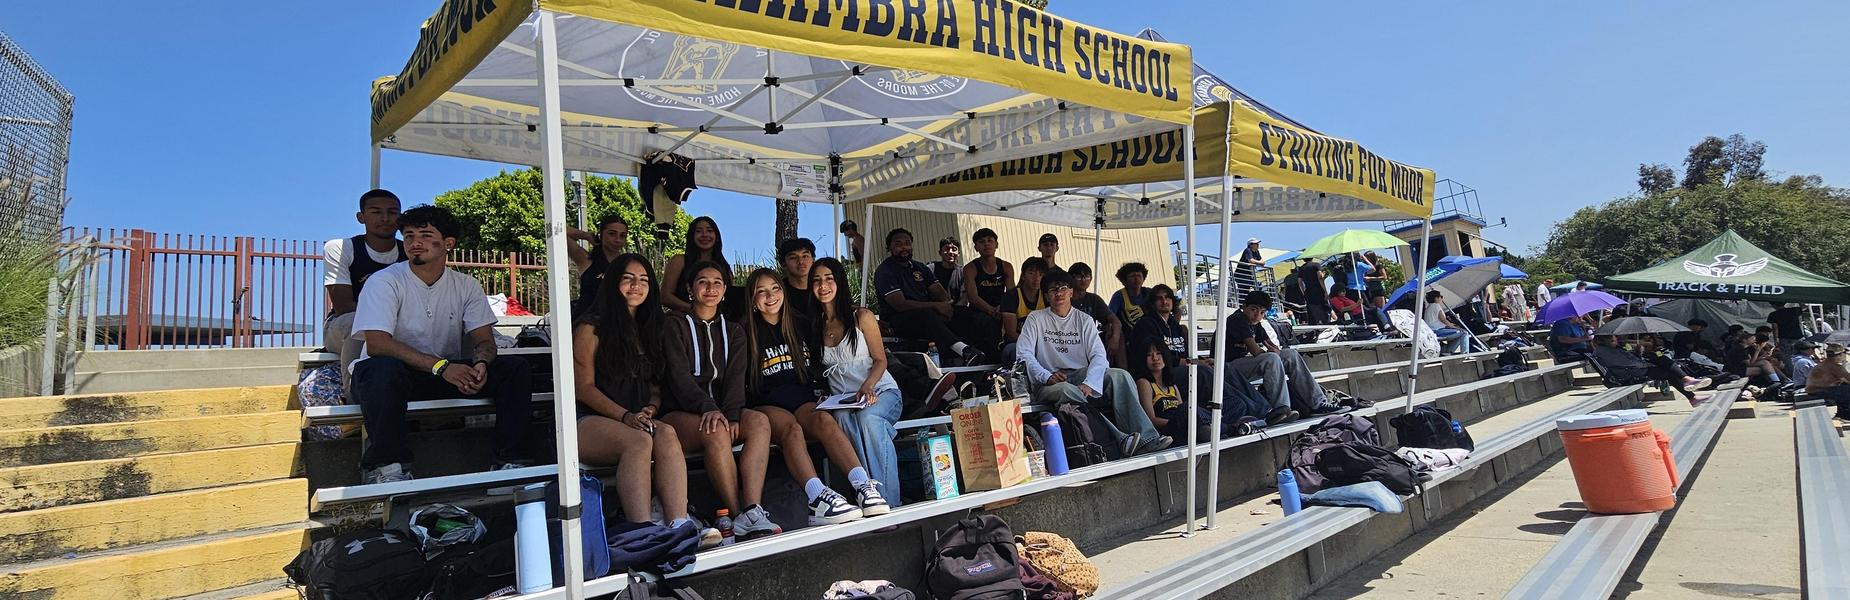
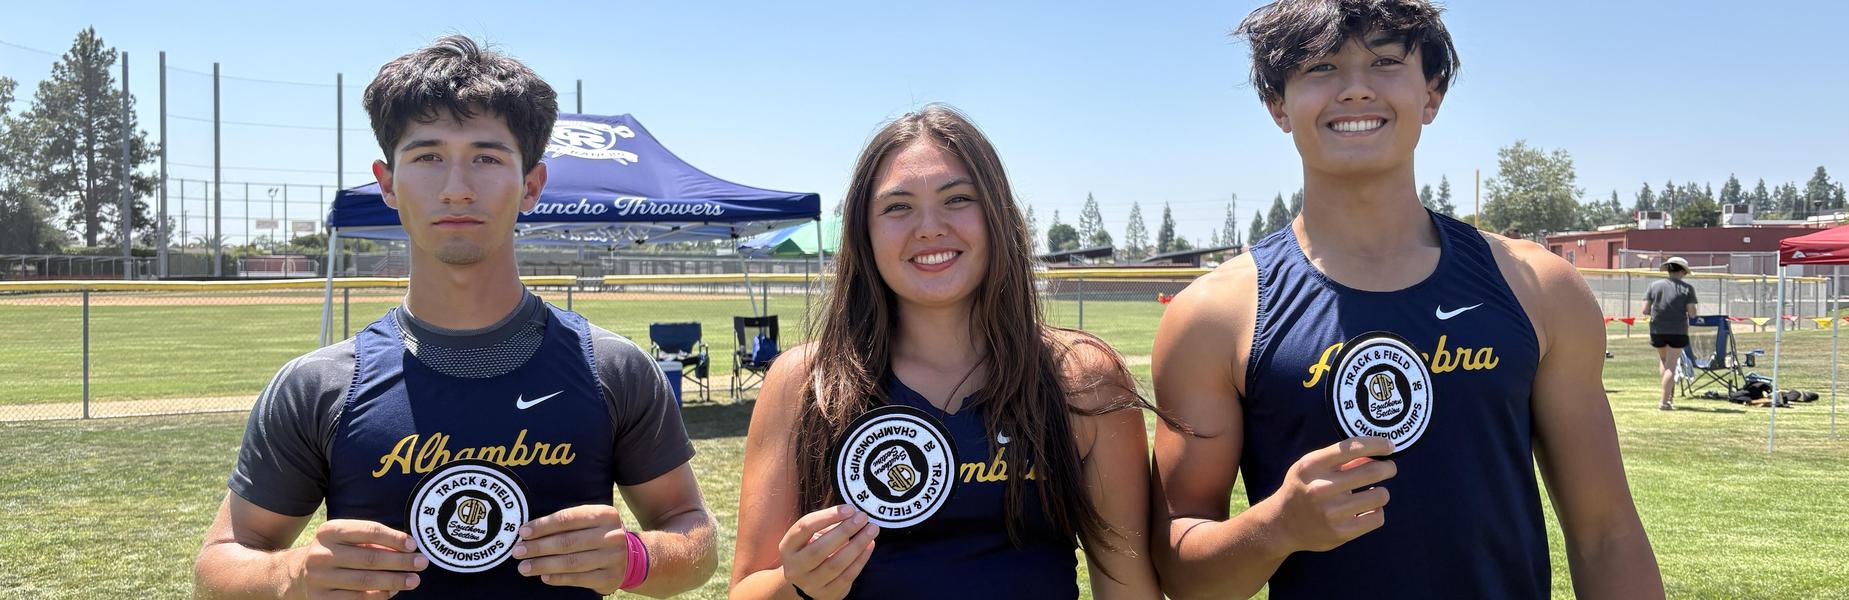
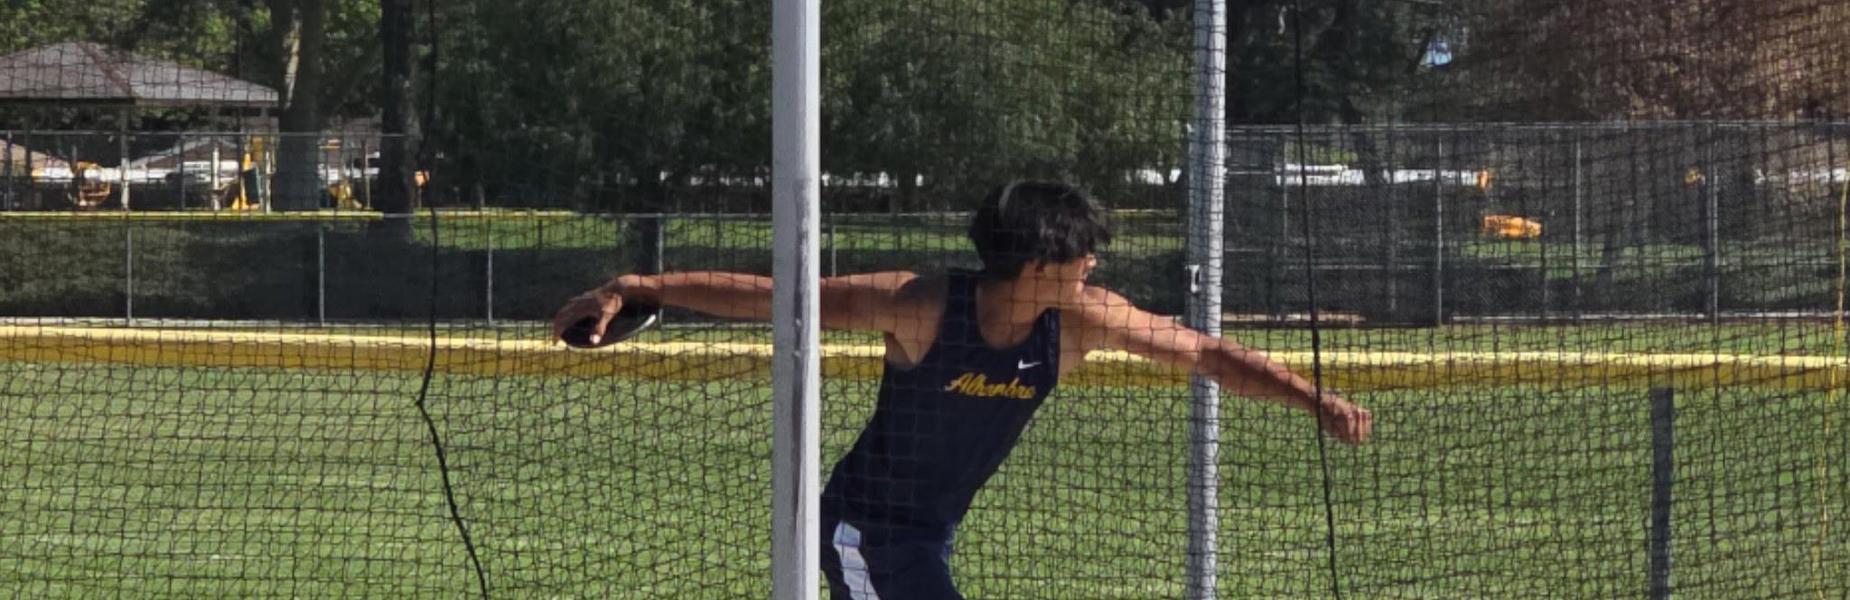
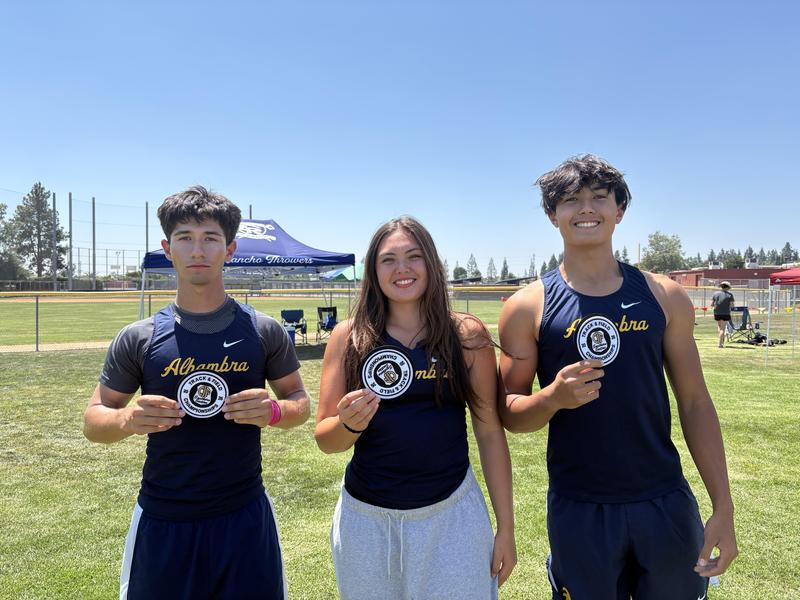
Alhambra Track and Field at Track Finals!
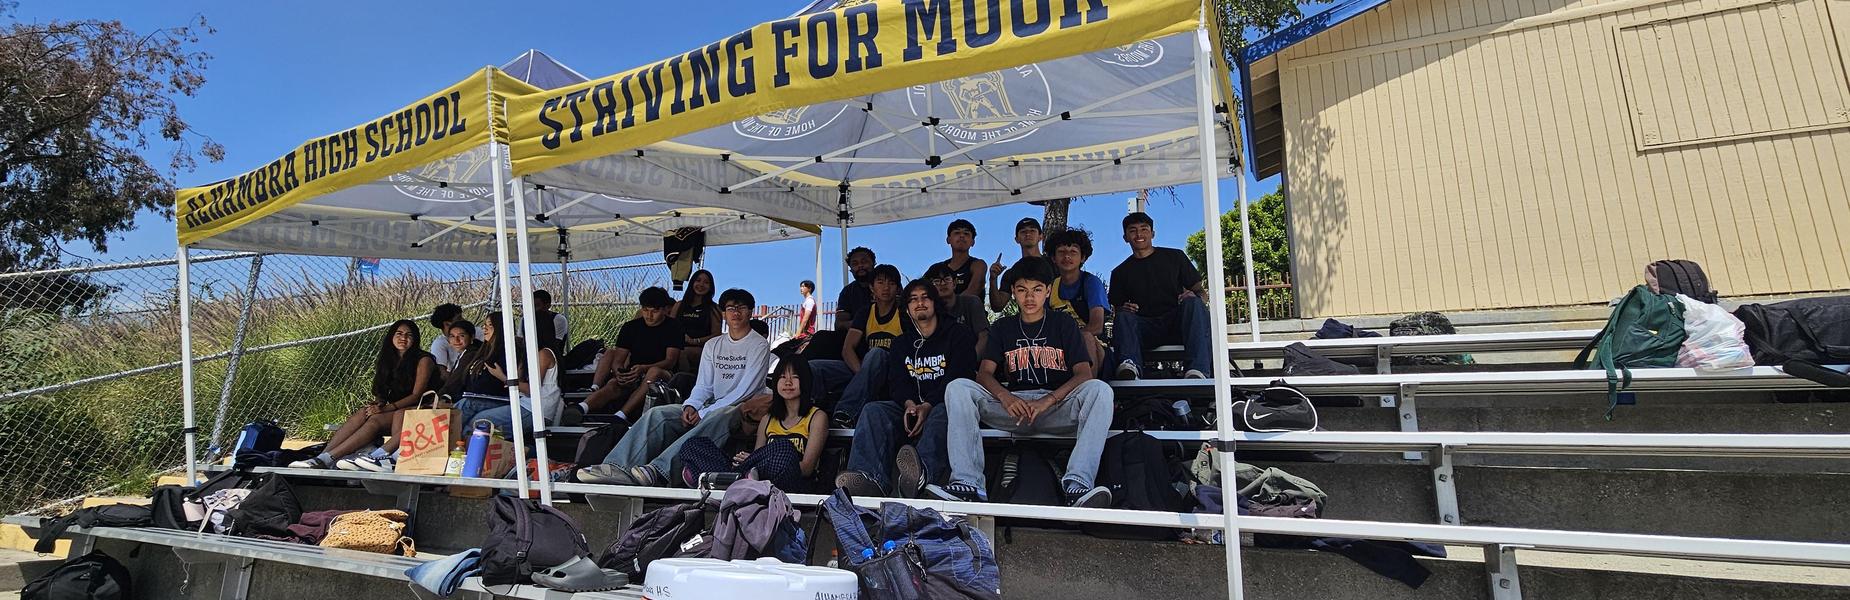
Track
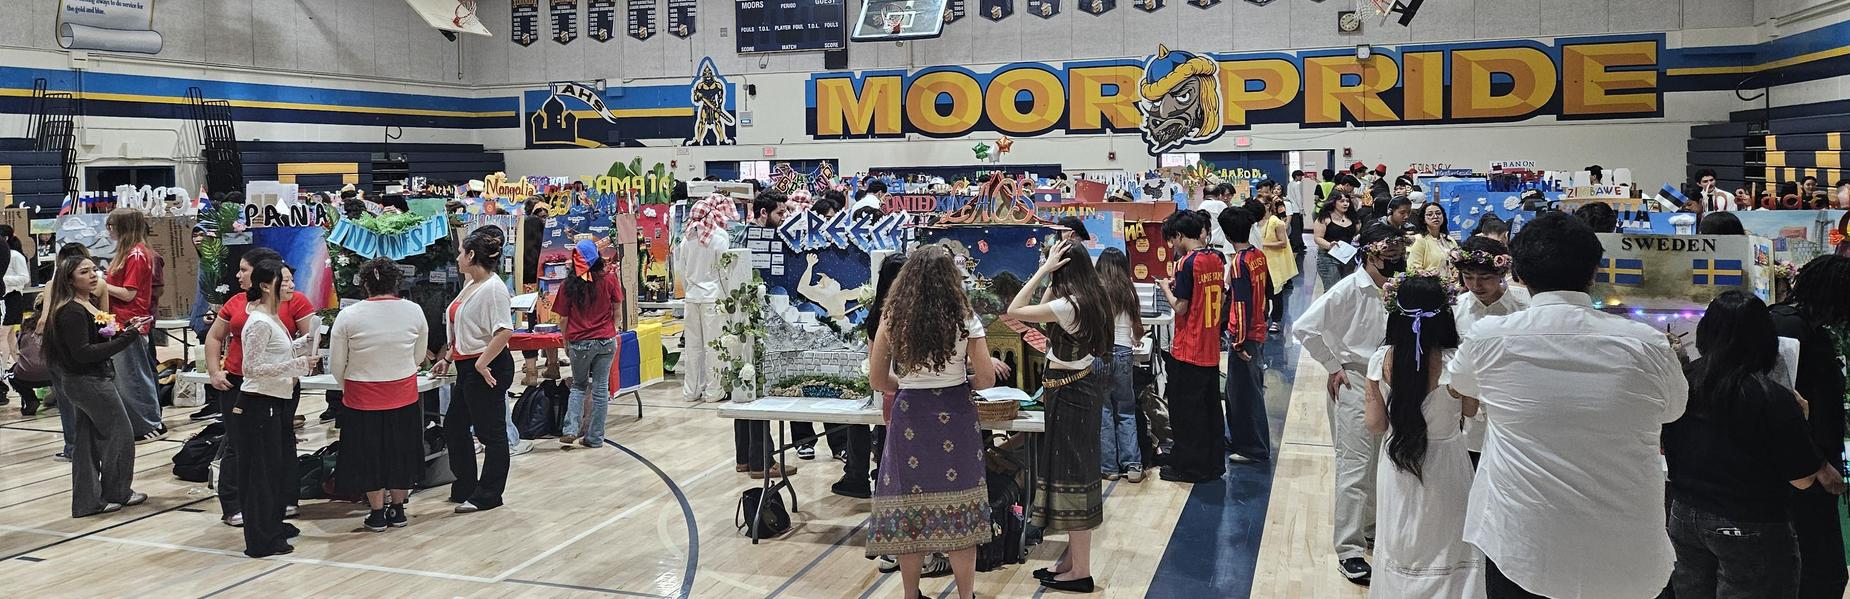
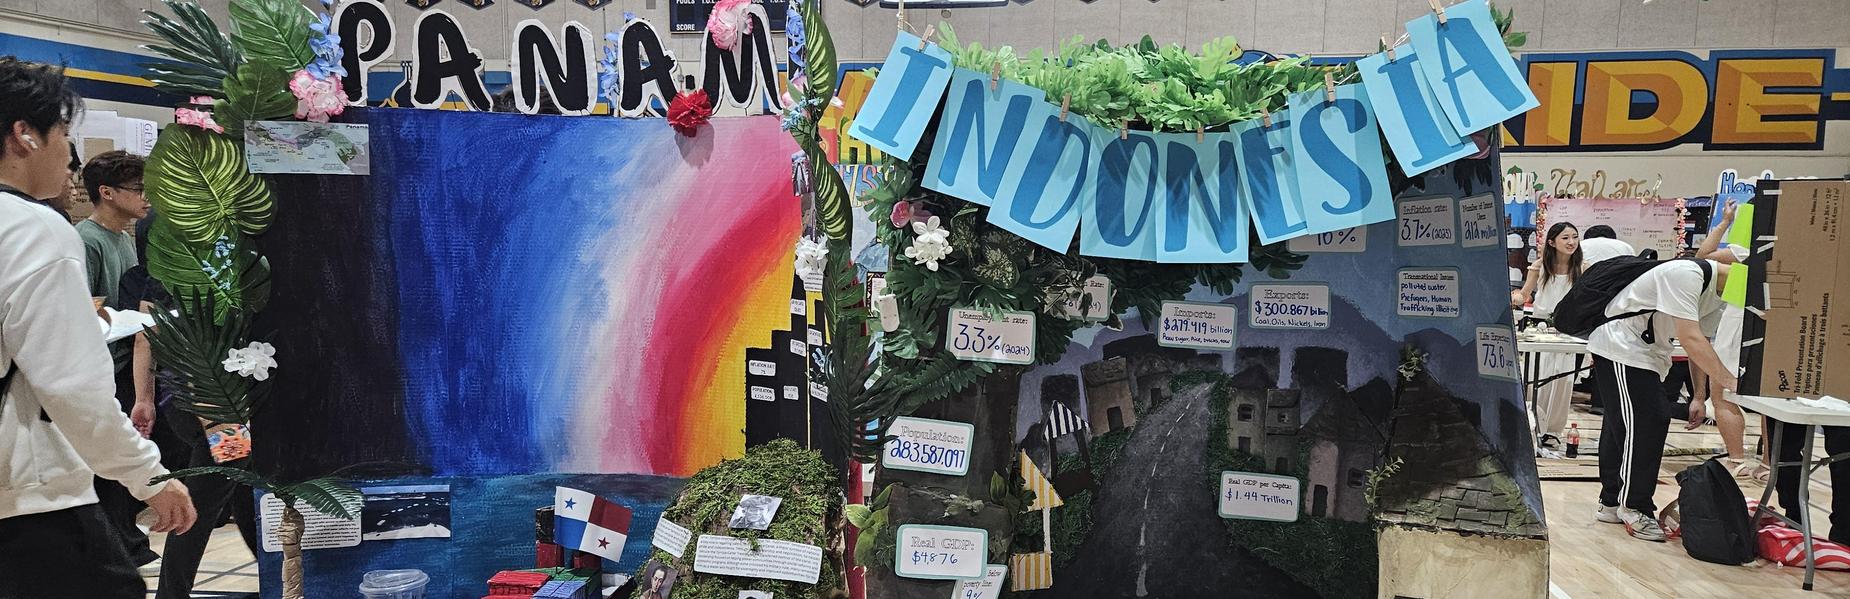
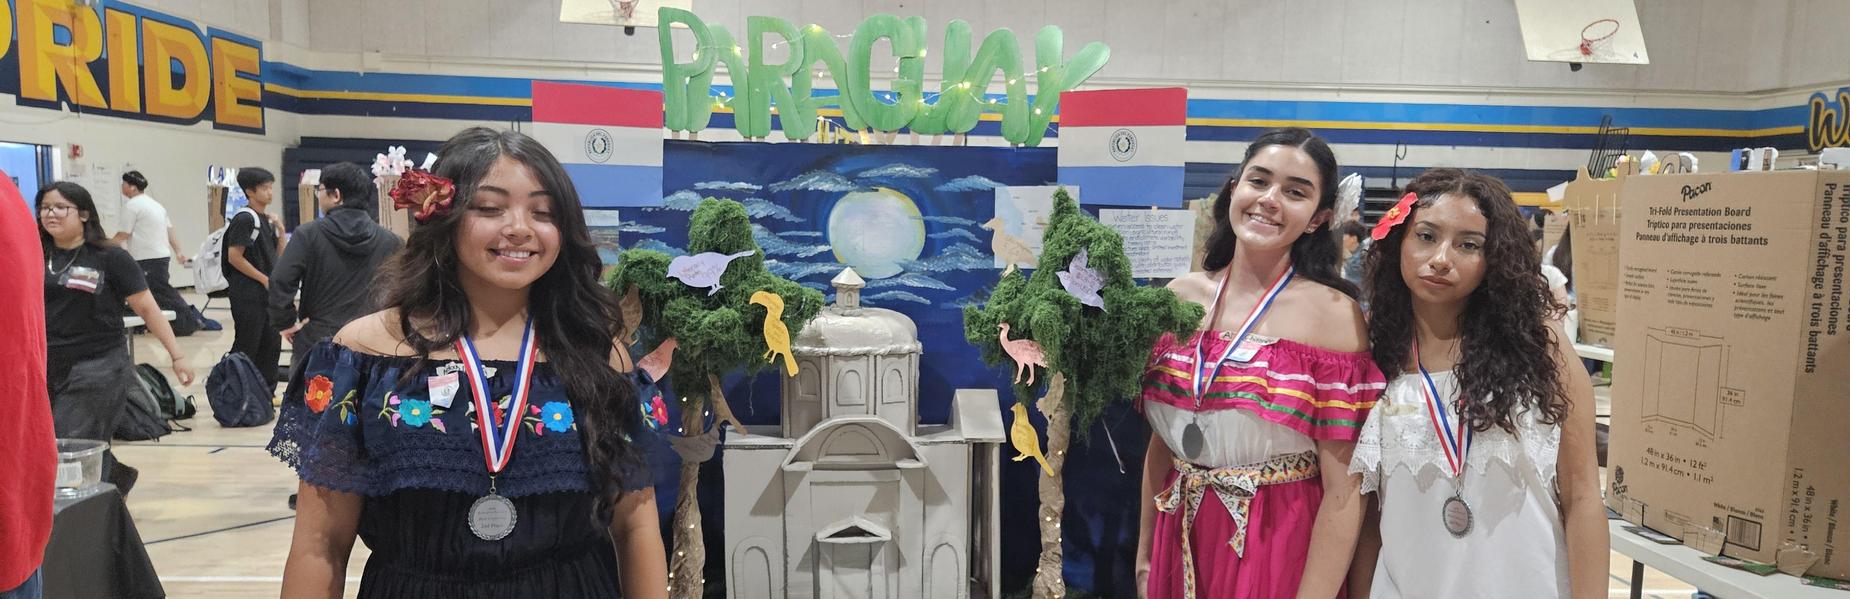
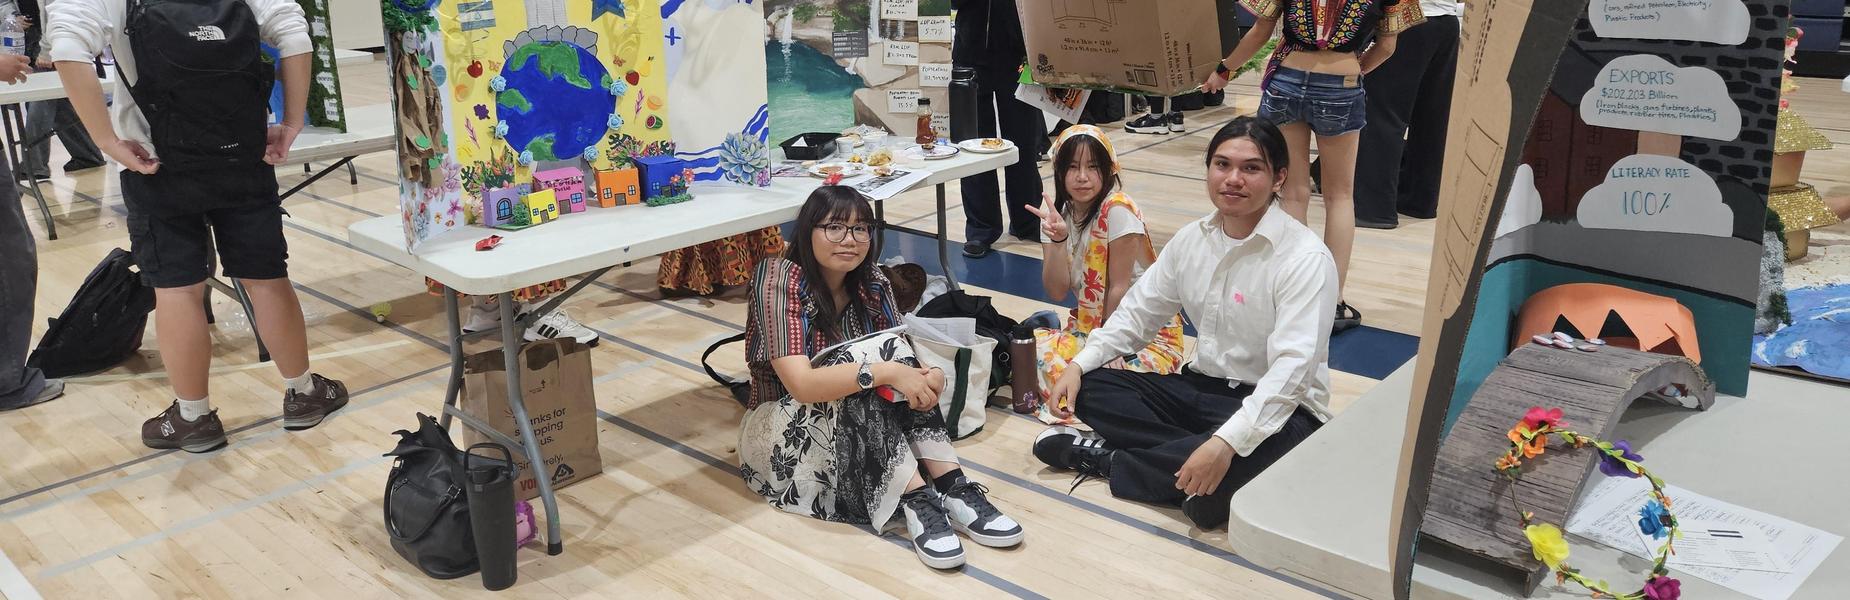
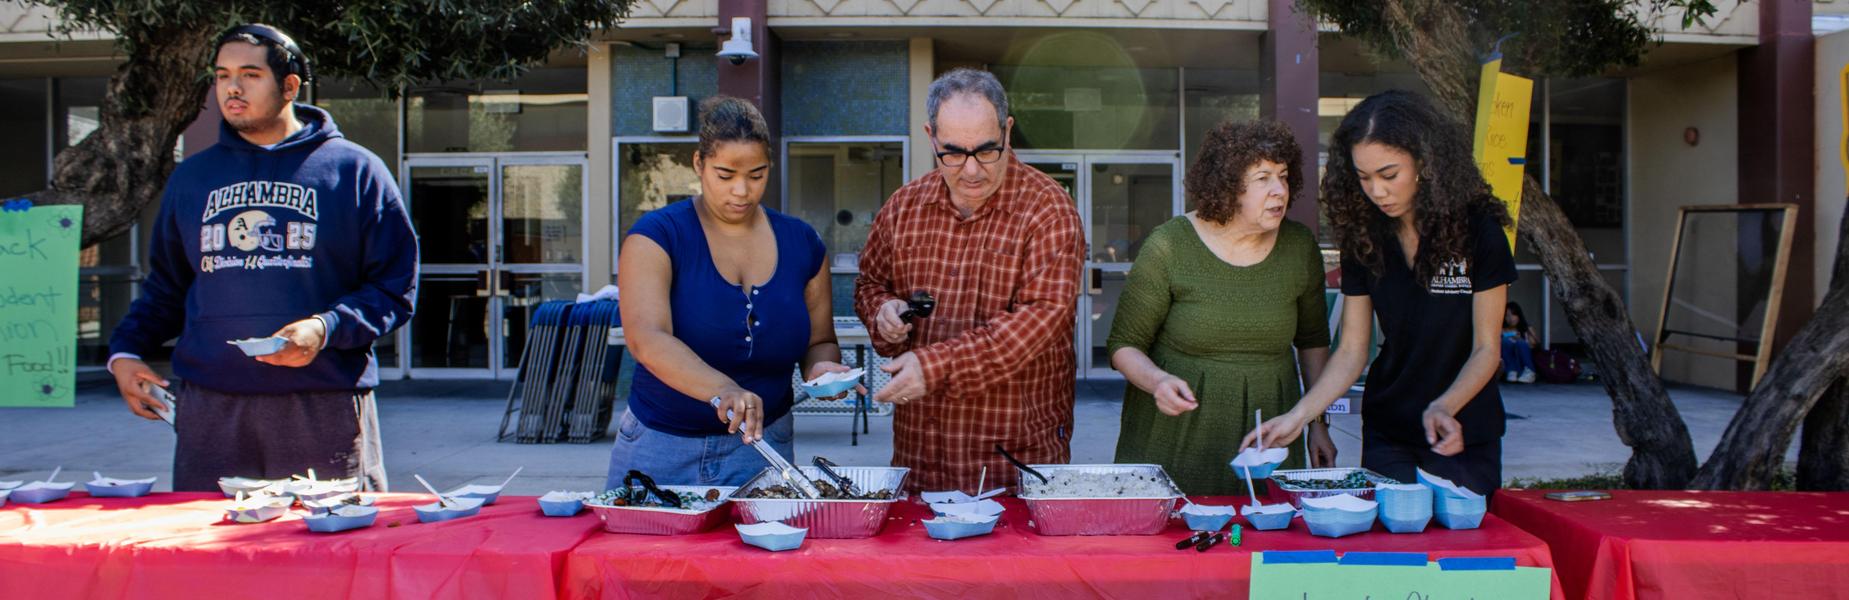
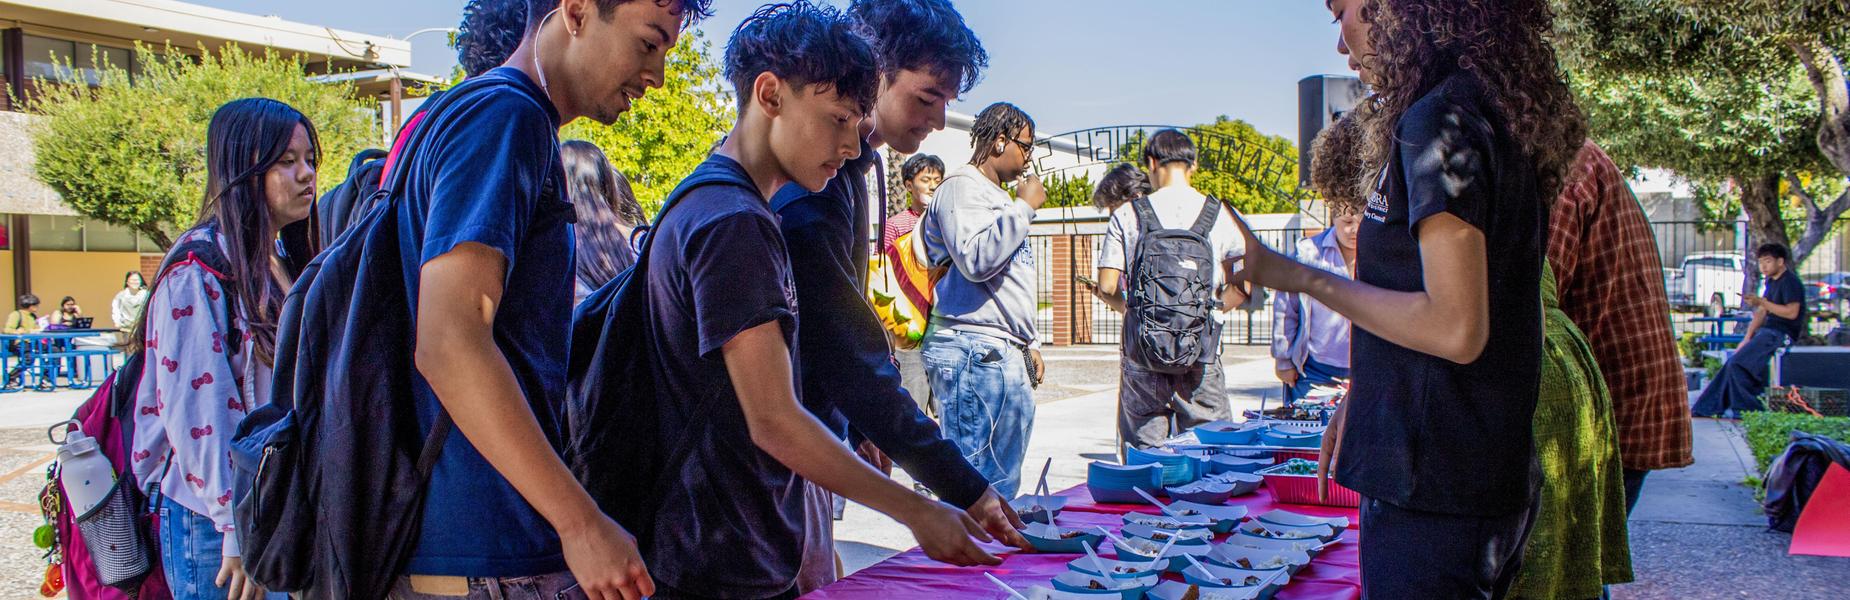
Welcome to the annual Econ Summit!!!
Getting ready for clean-up
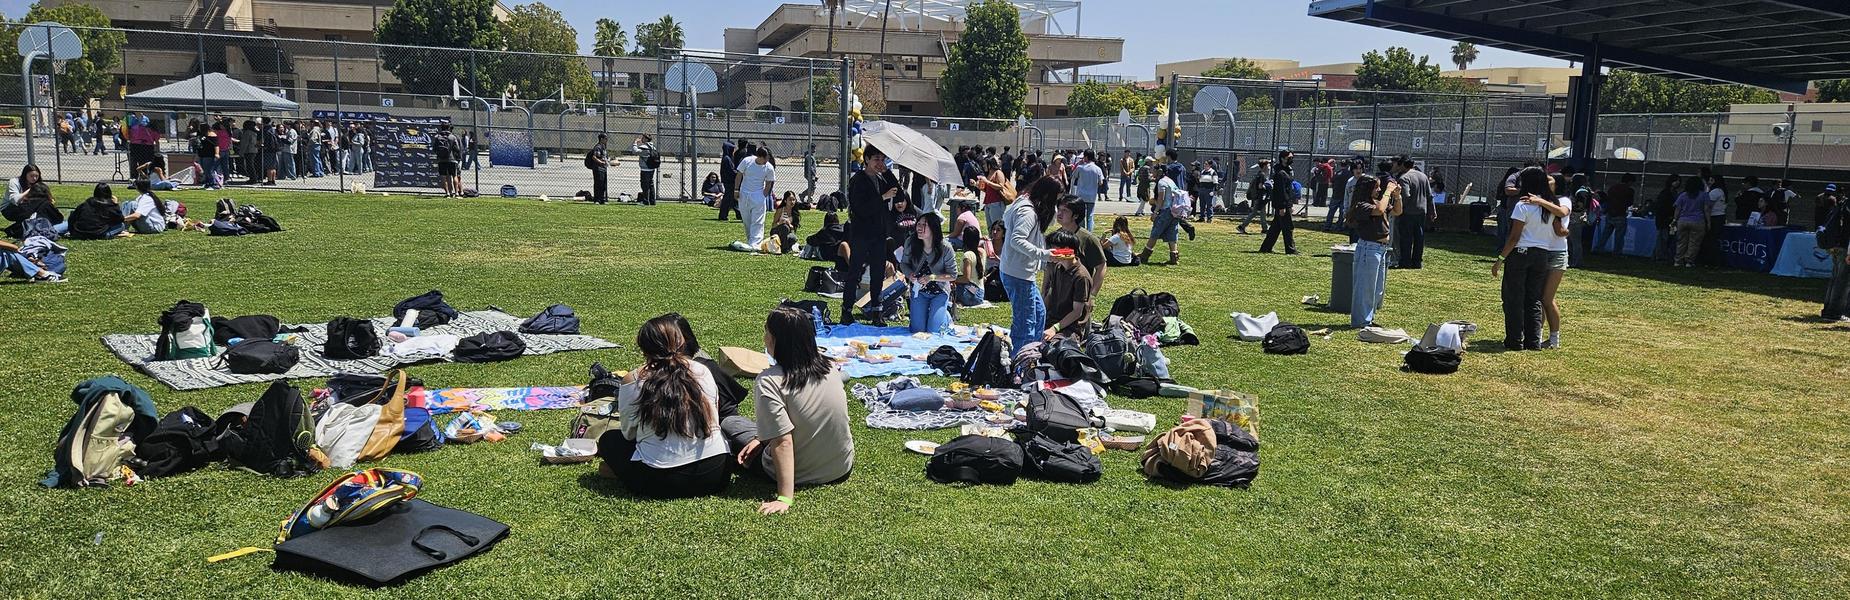
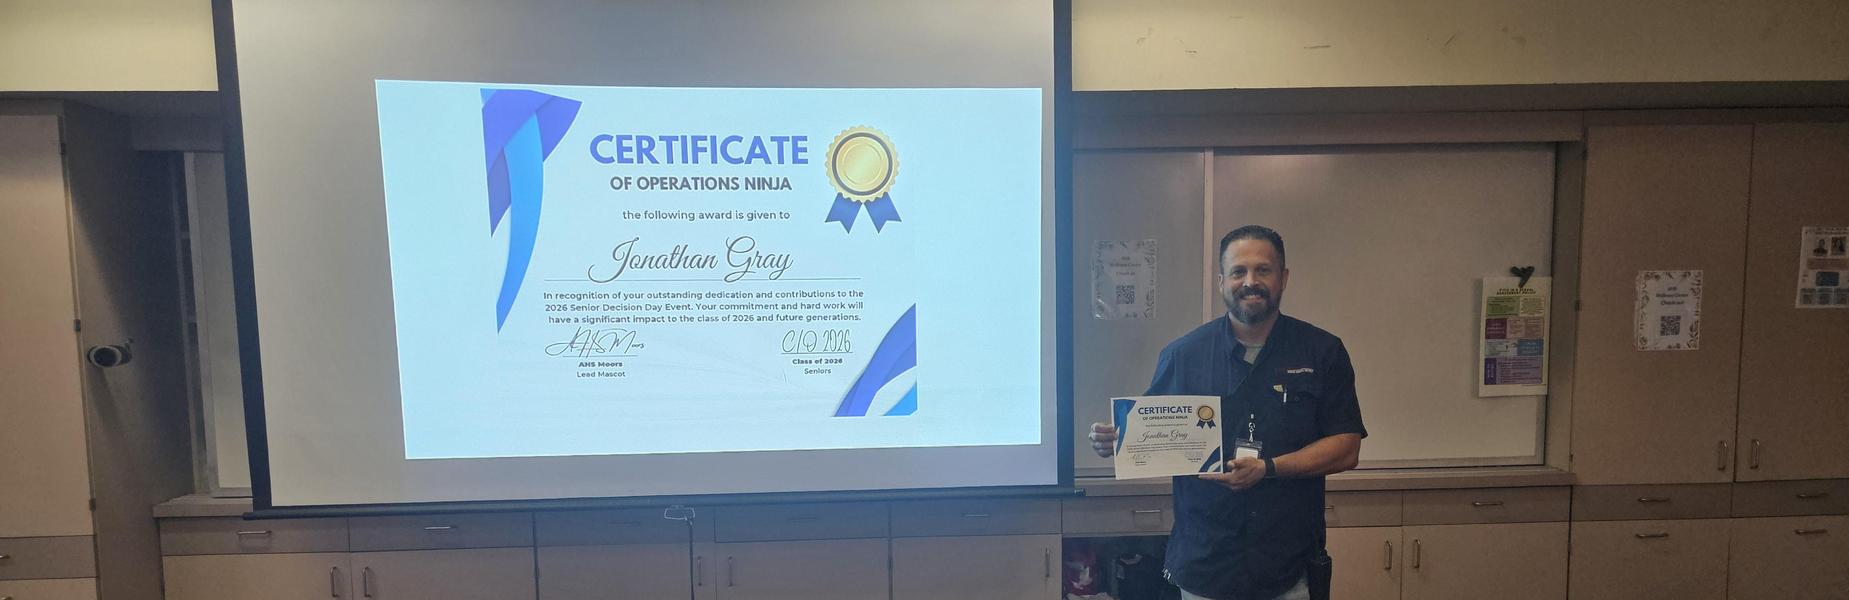
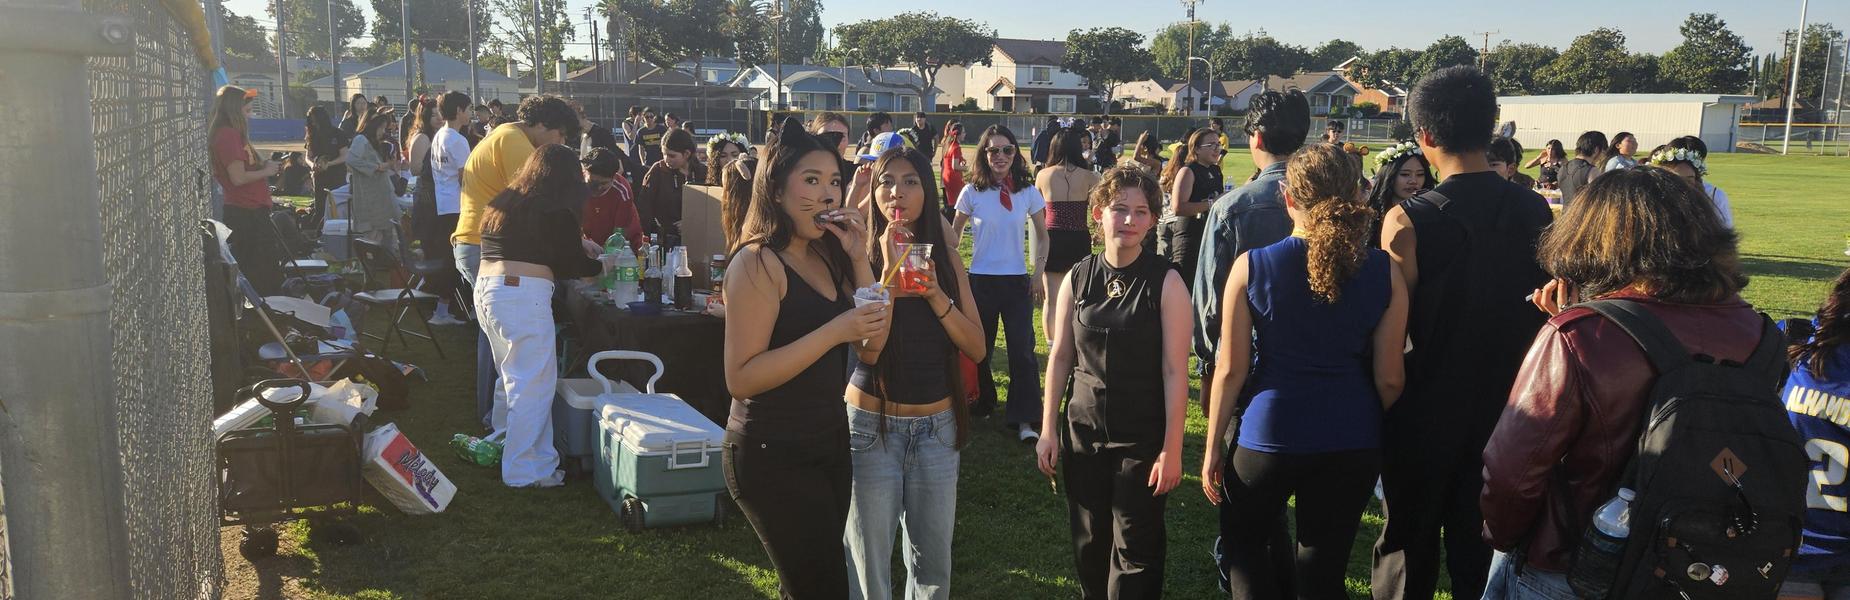
Decision Day Picnic
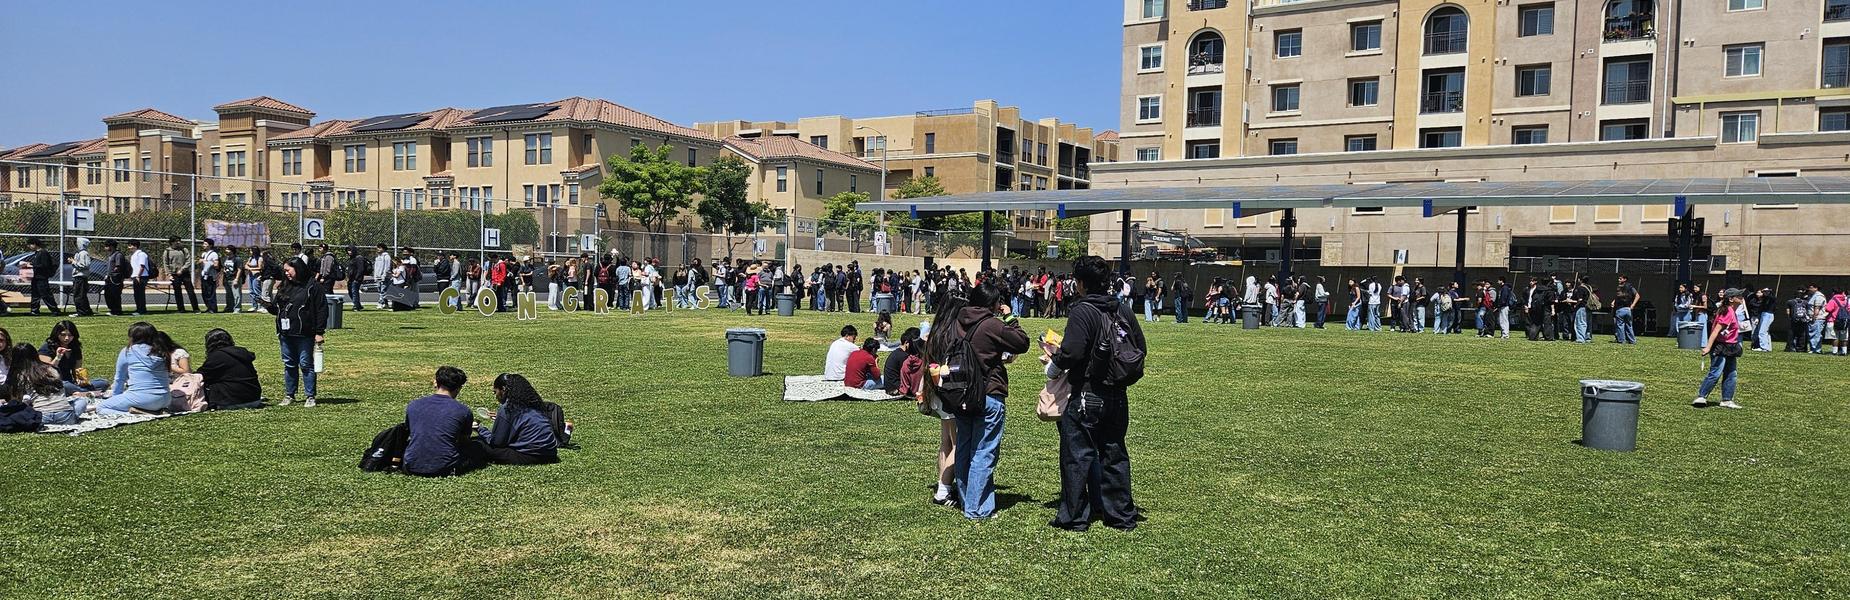
Decision Day Picnic
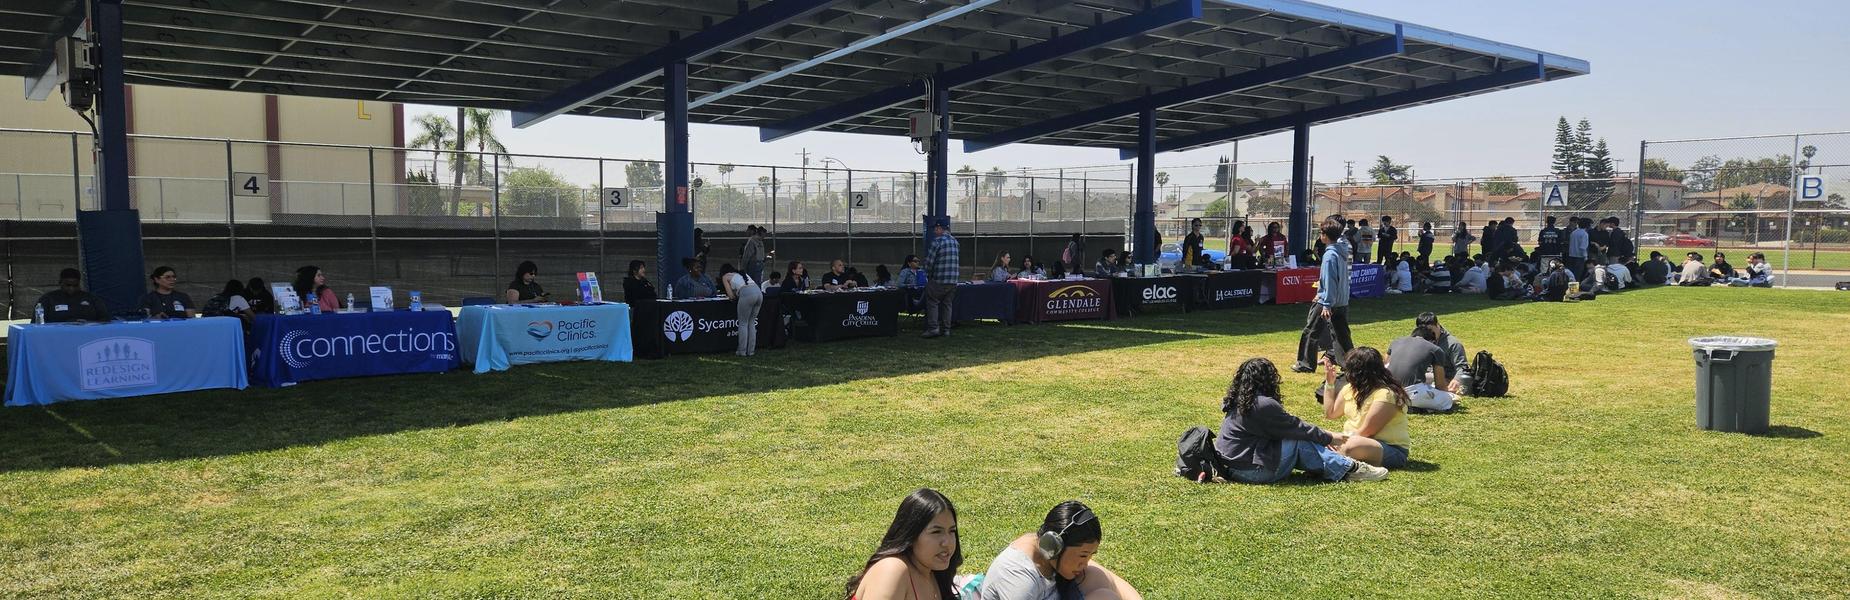
Decision Day Picnic
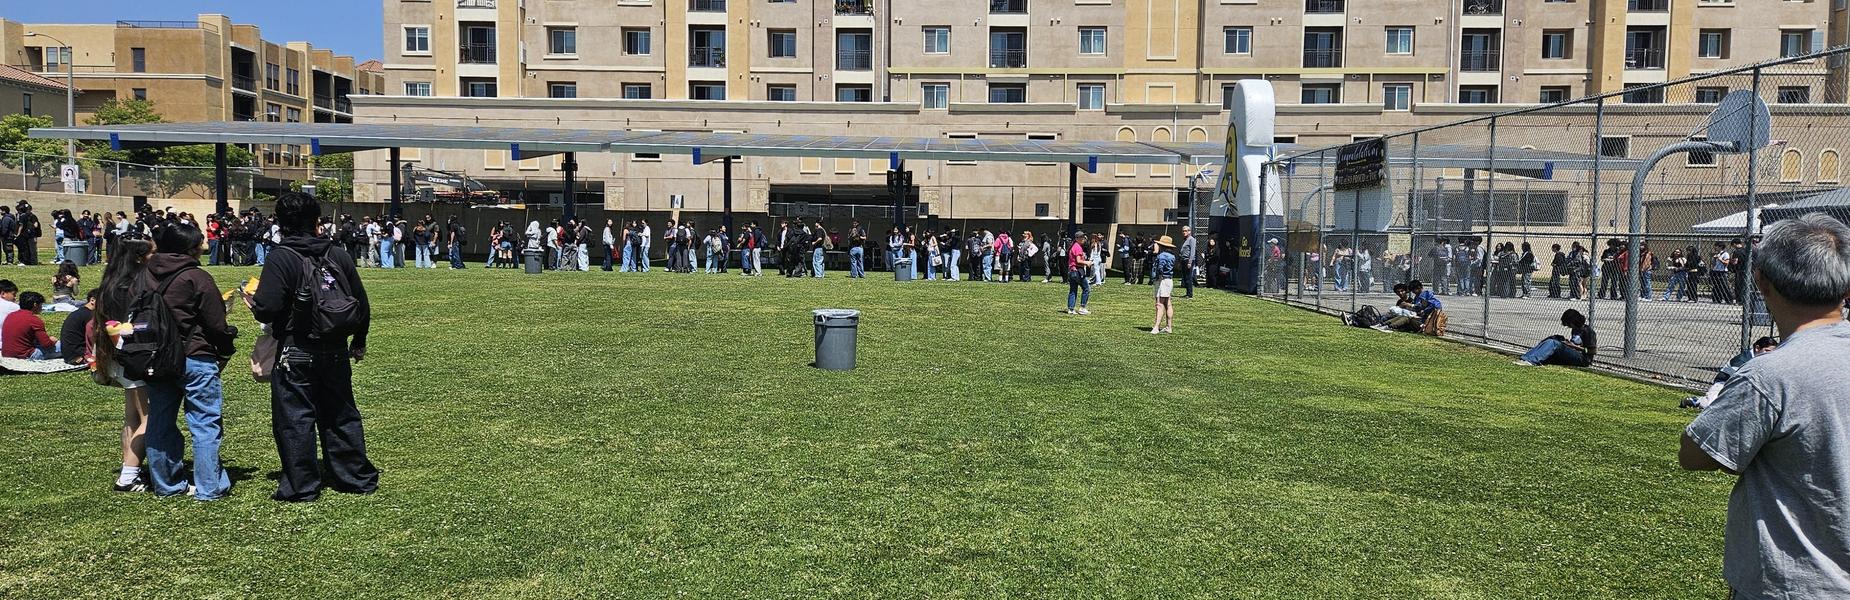
Decision Day Picnic
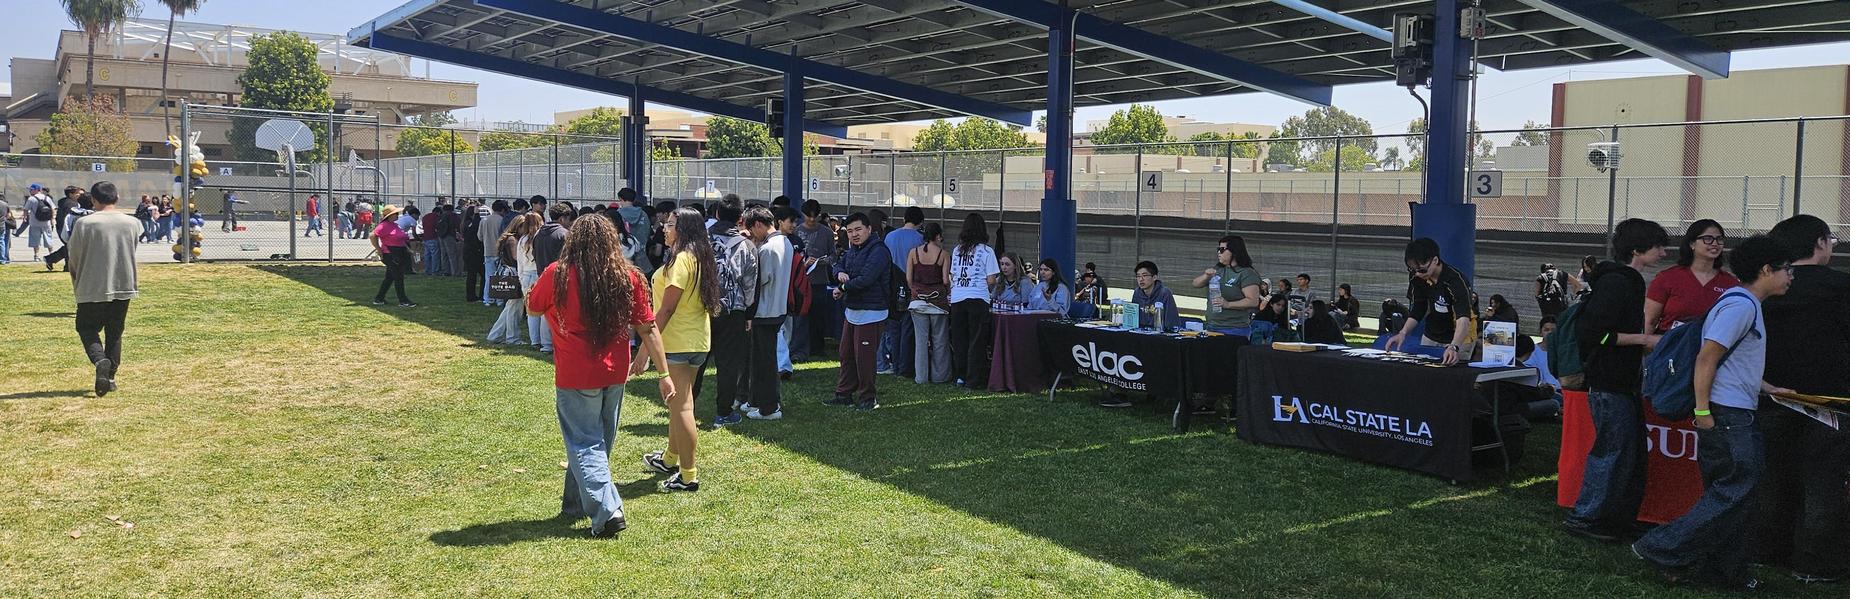
Decision Day Picnic
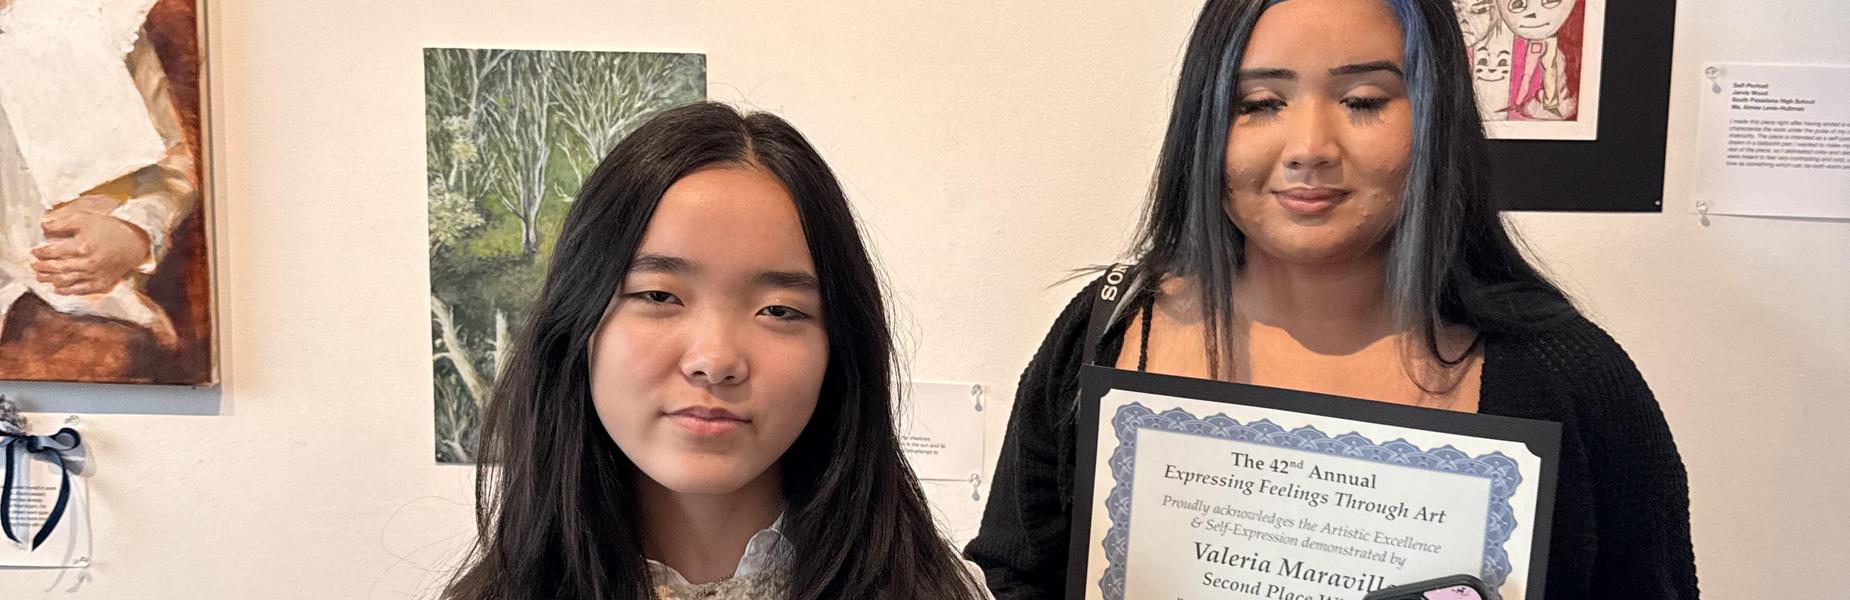
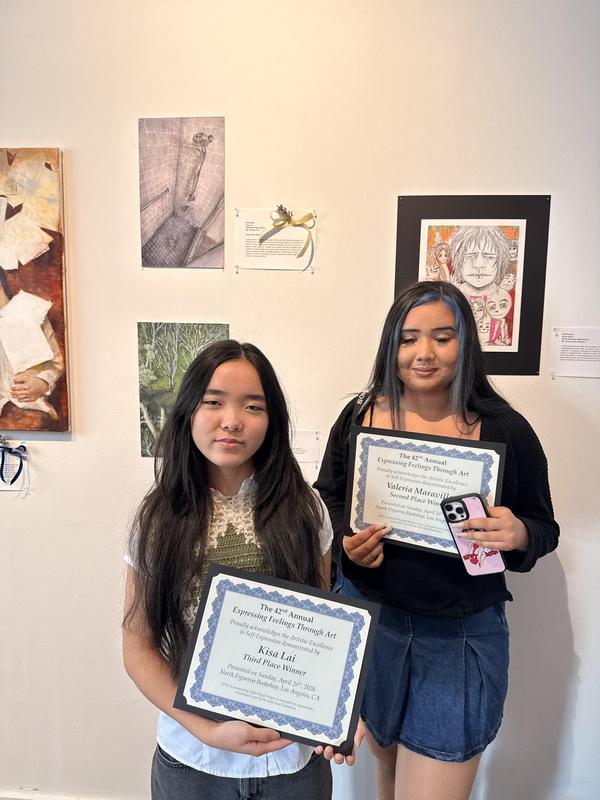
Expressing Feelings Art Show winners: Kisa Lai 3rd place, Painting, & Valeria Maravilla 2nd place, Photography
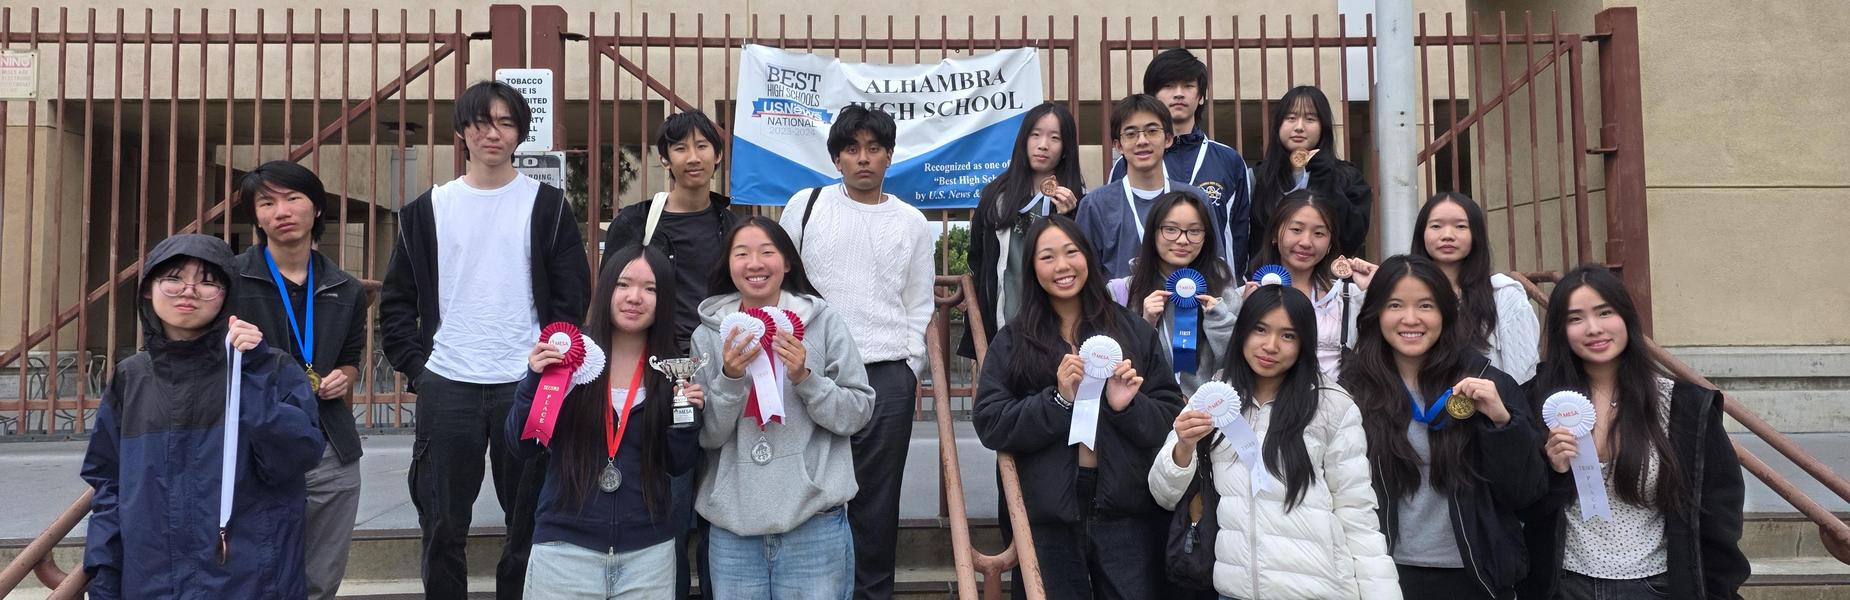
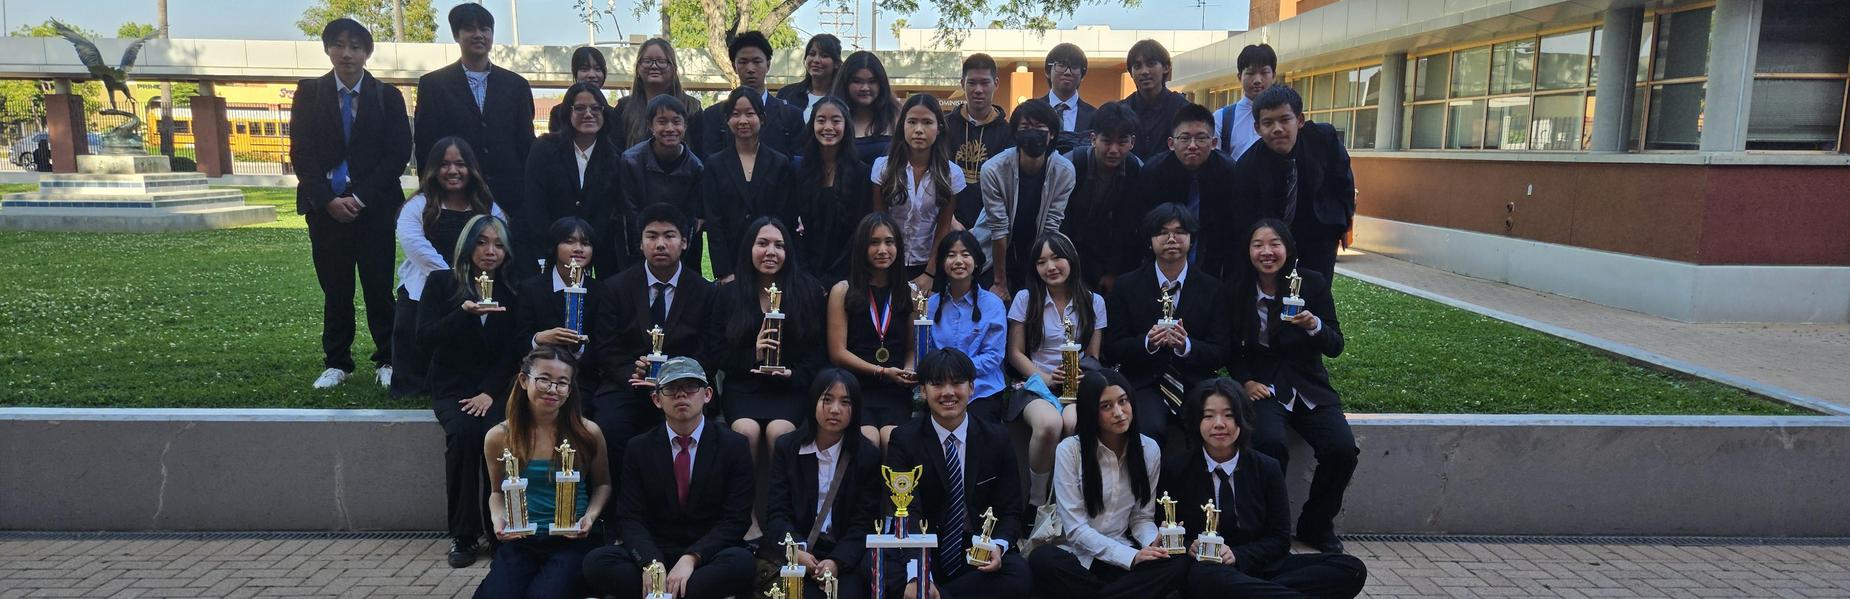
MESA Regional Competition Participants - Congrats!
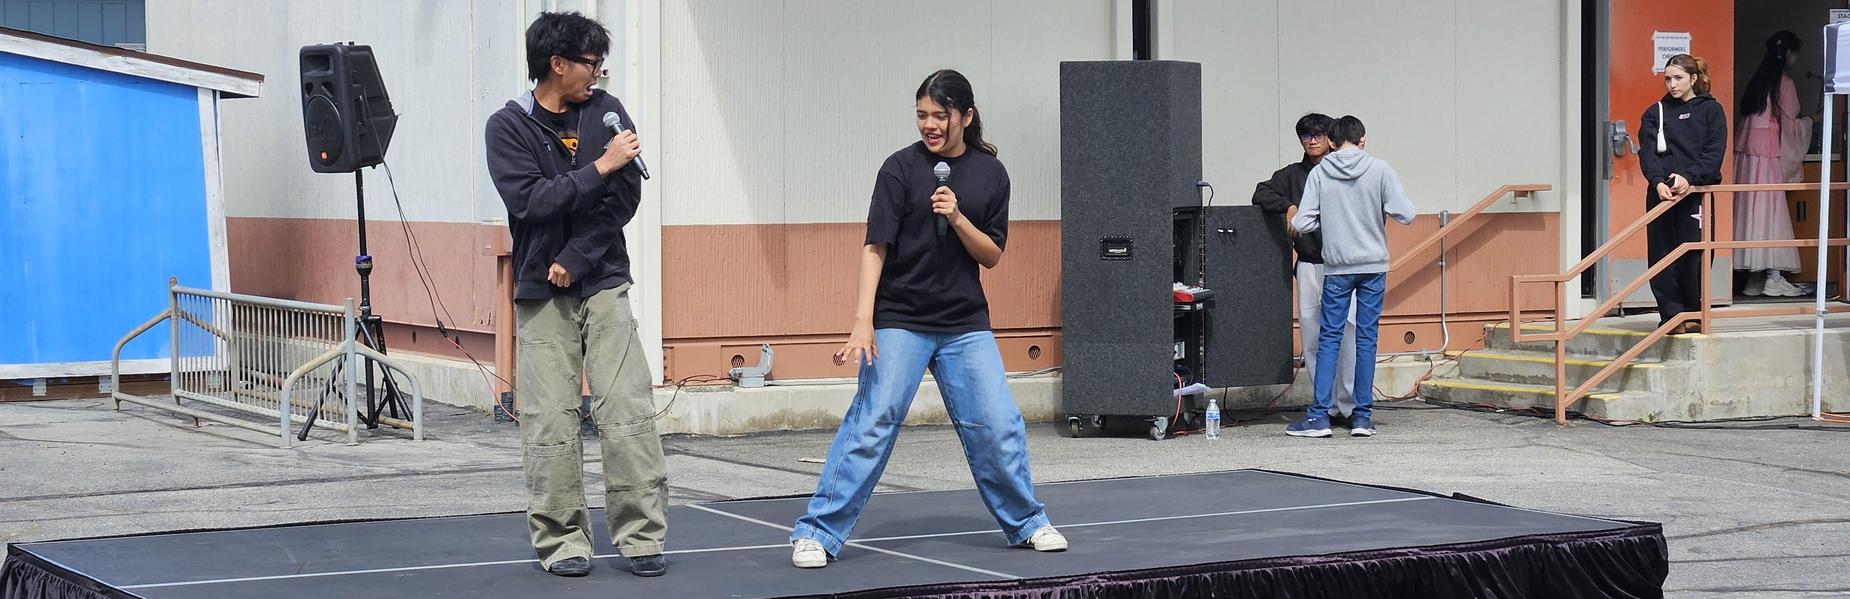
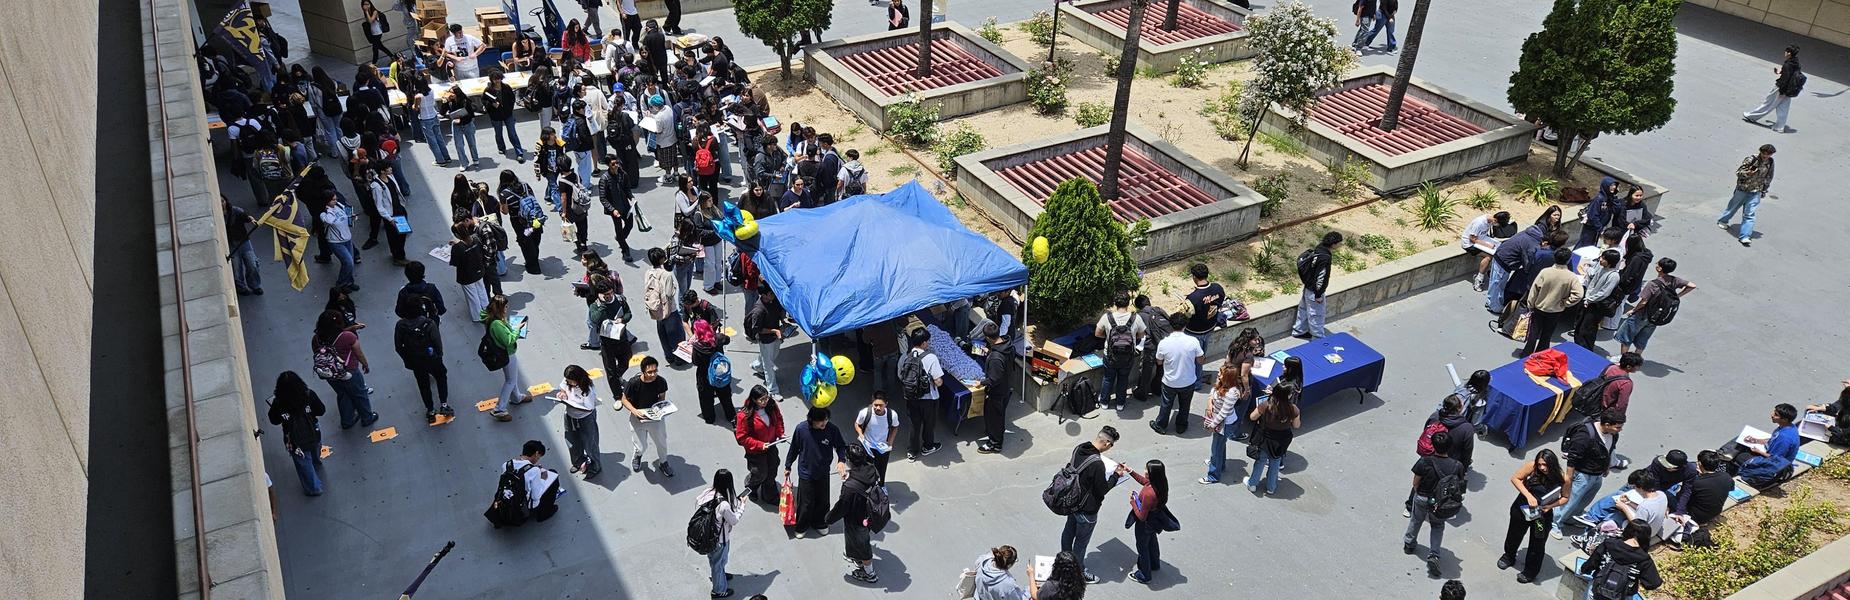
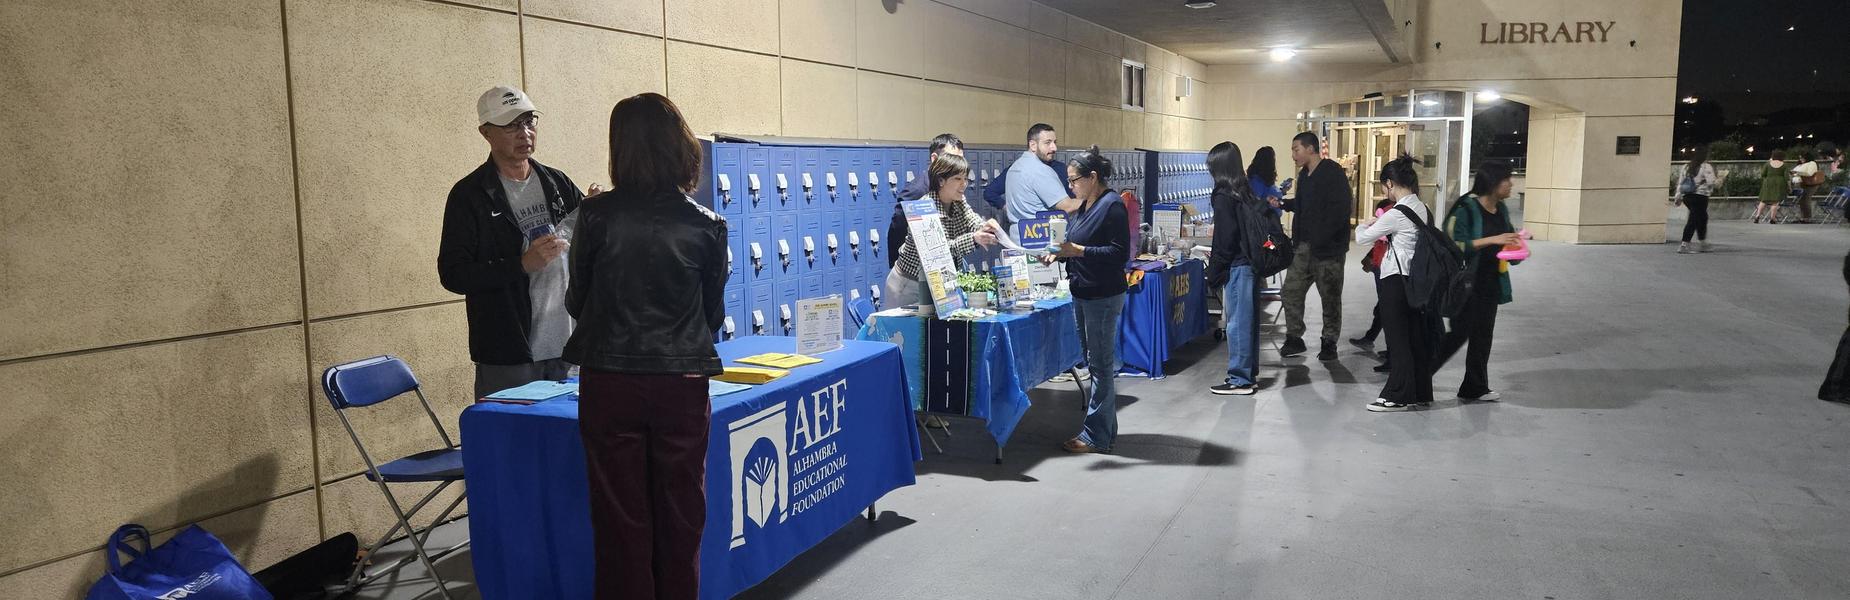
Community Schools Fair - Speech Team Performance
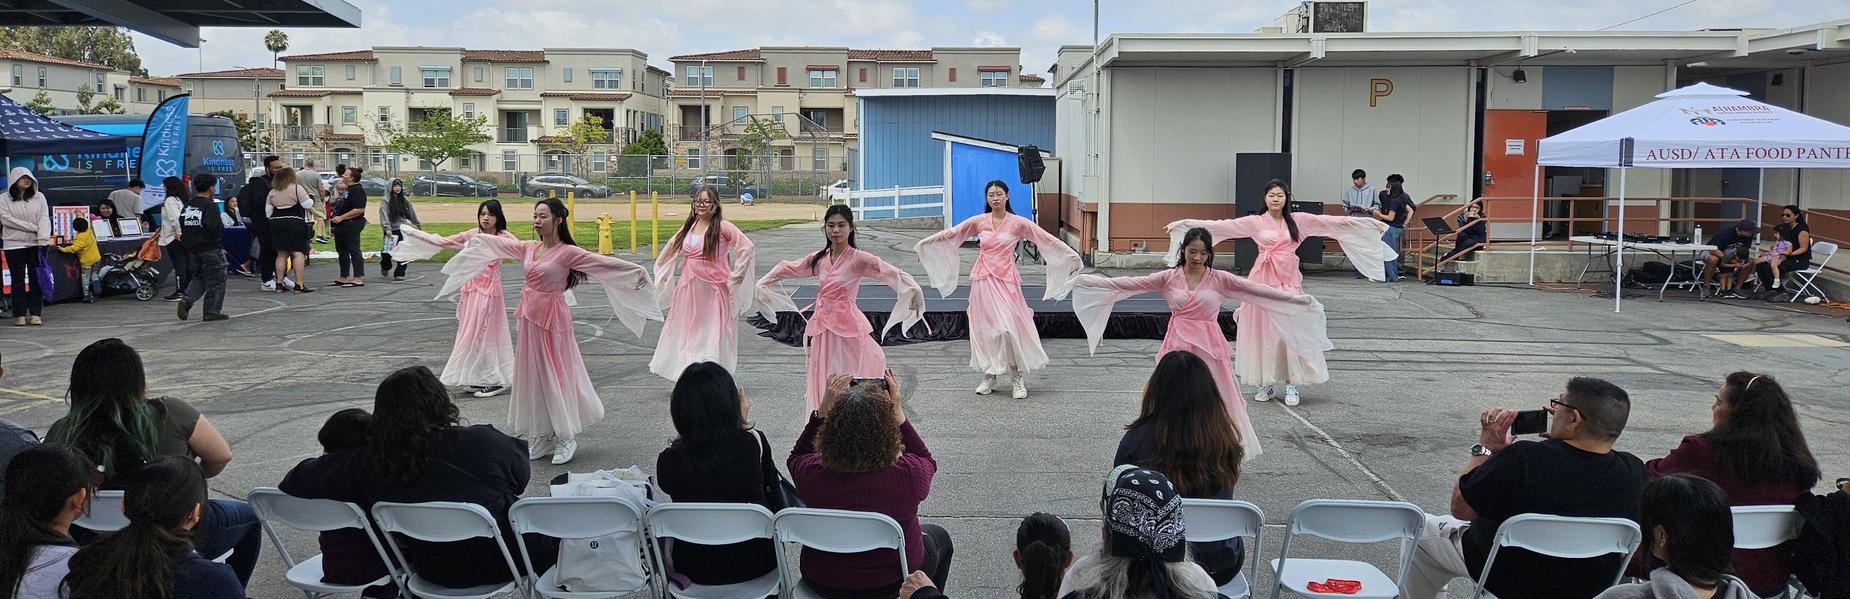
Community Schools Fair - Traditional Chinese Dancing
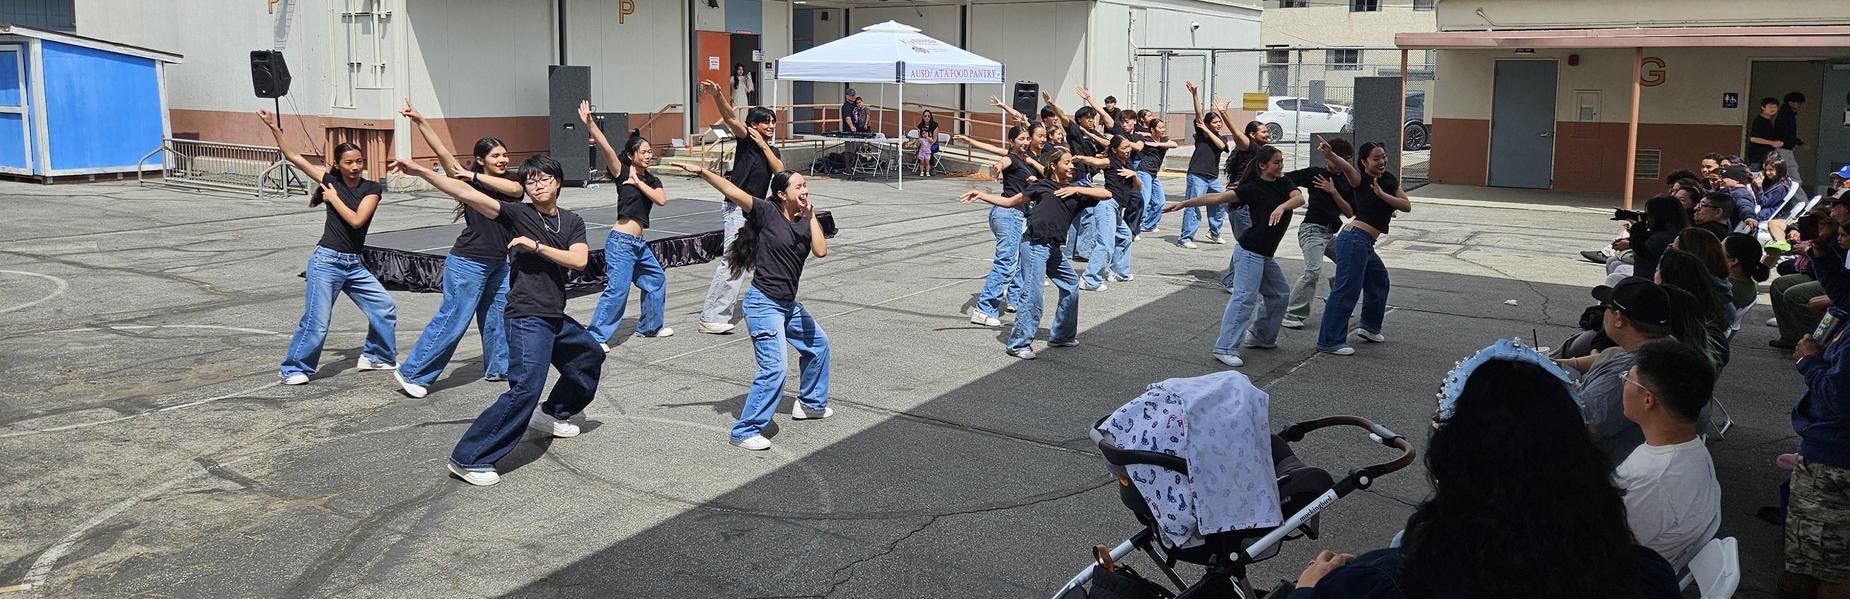
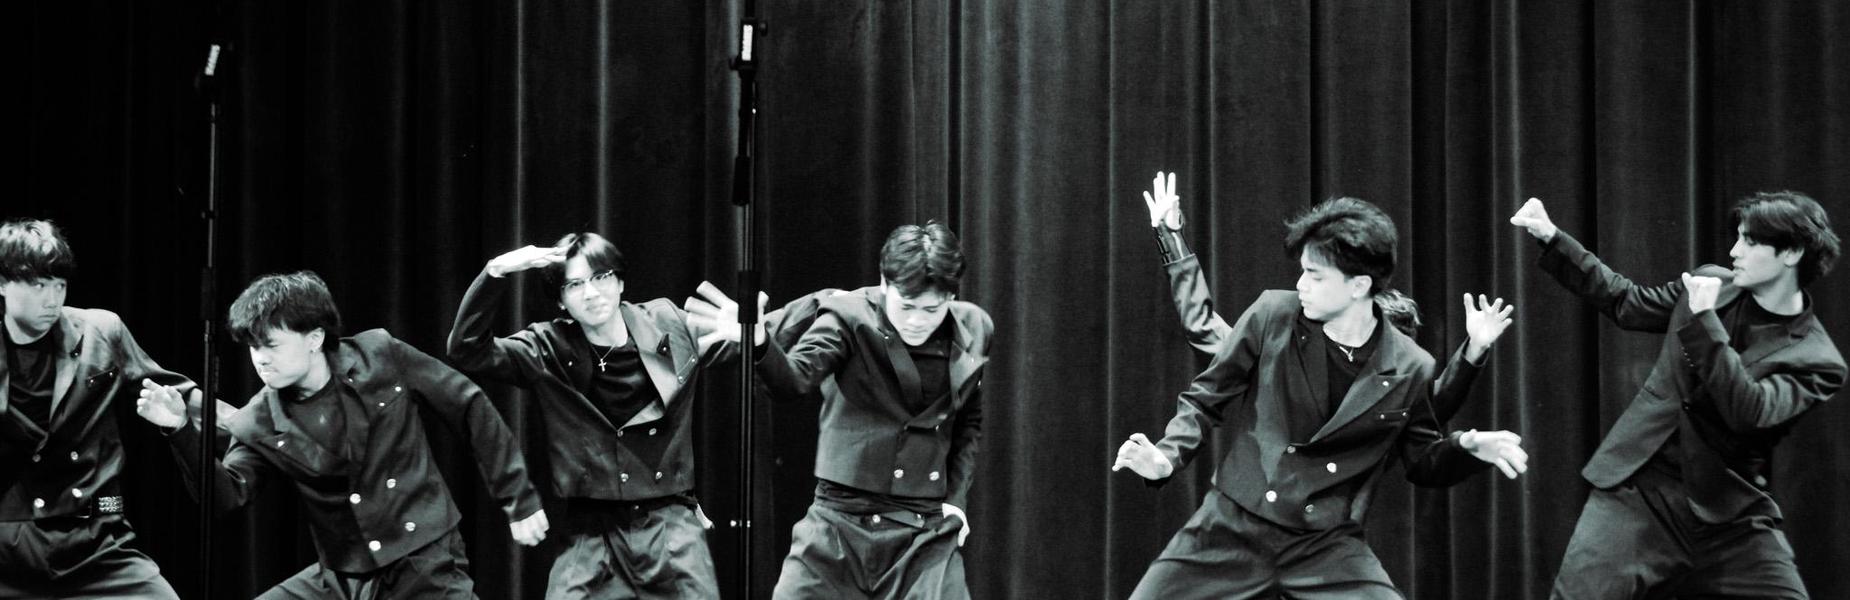
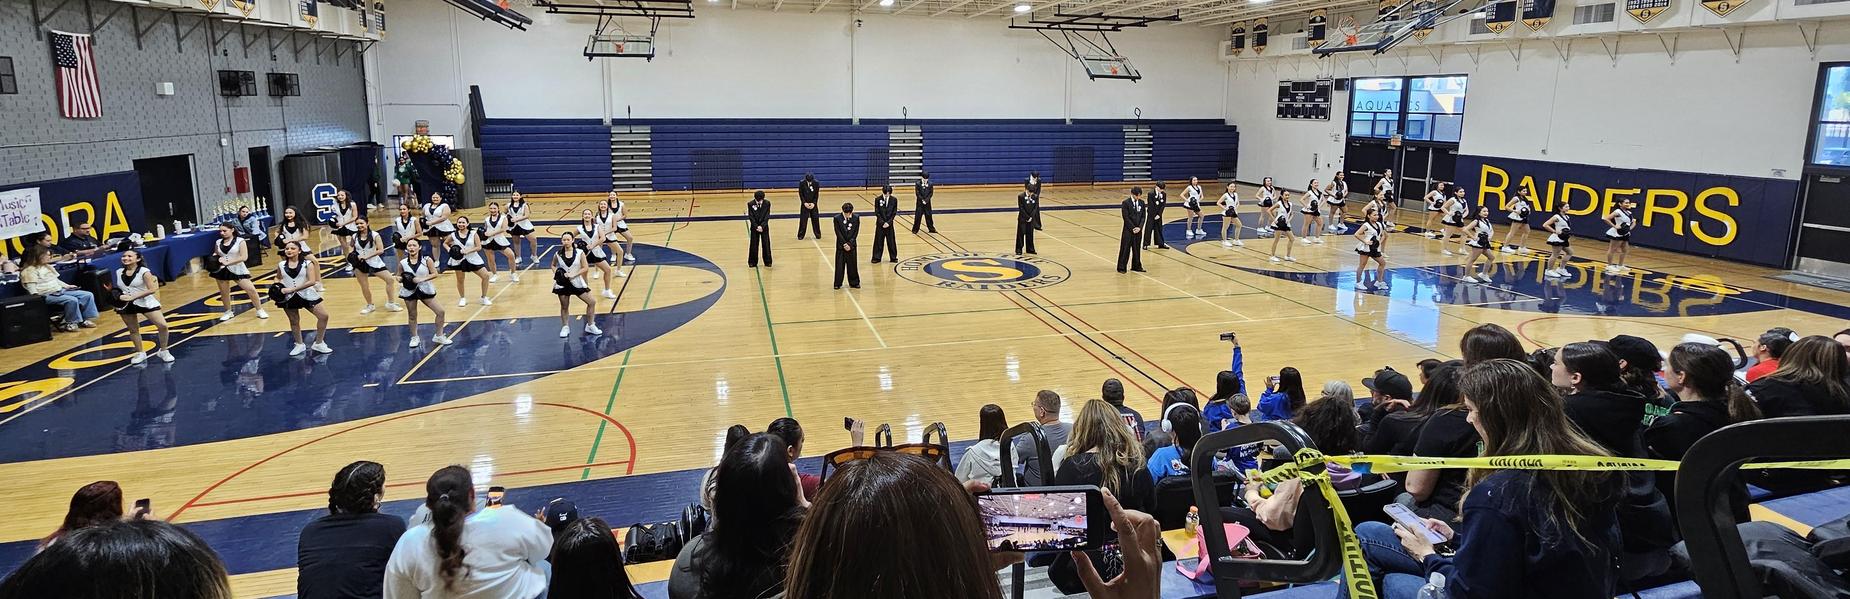
Community Schools Fair - CoEd Hip Hop
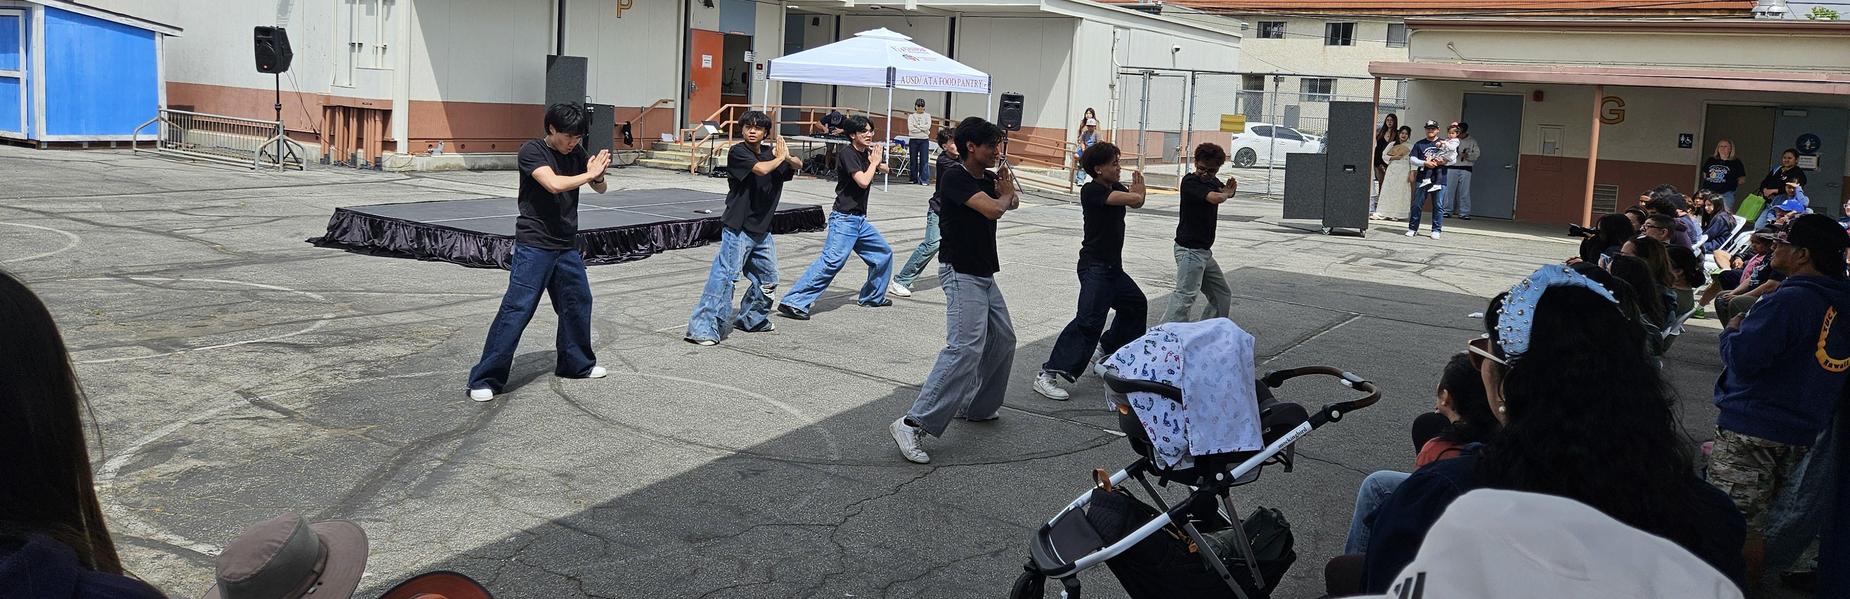
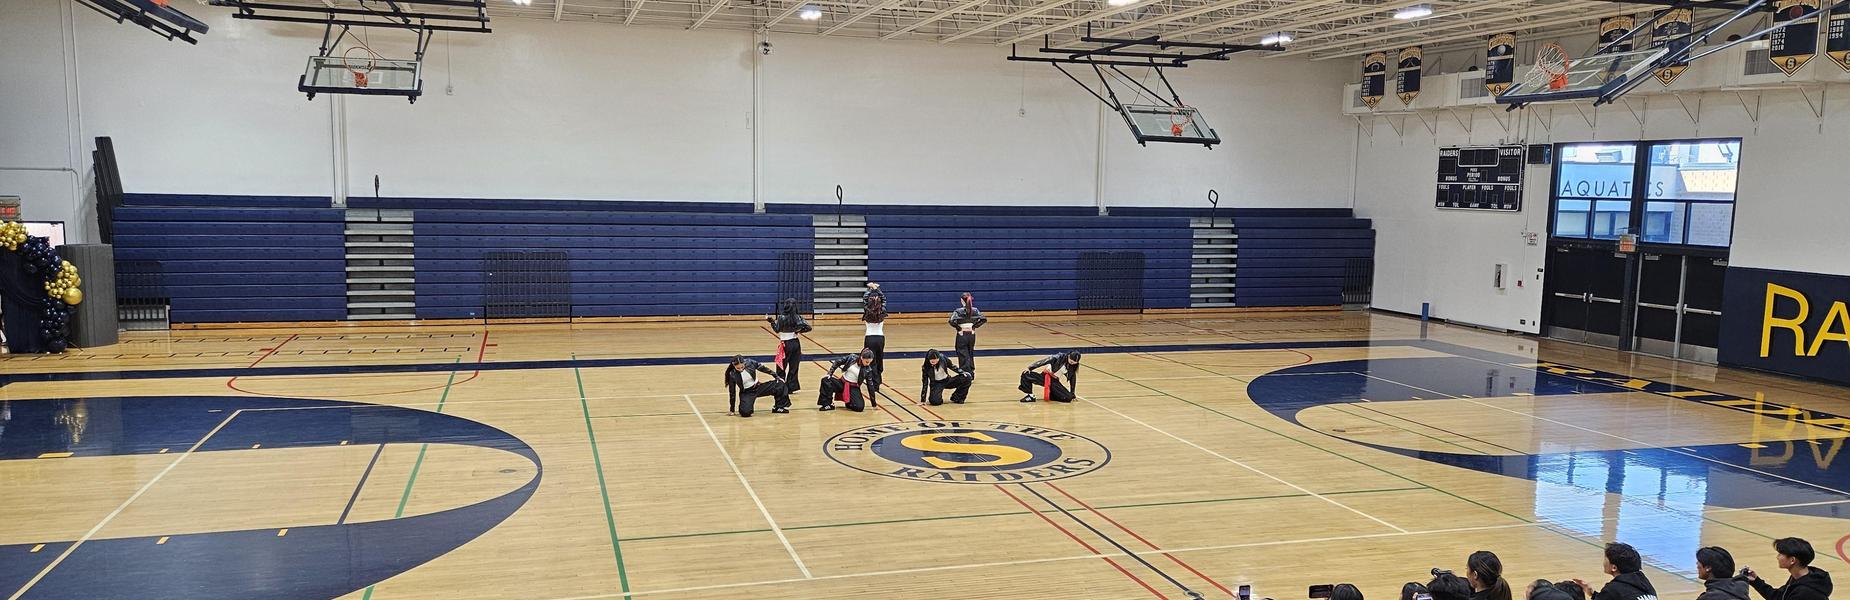
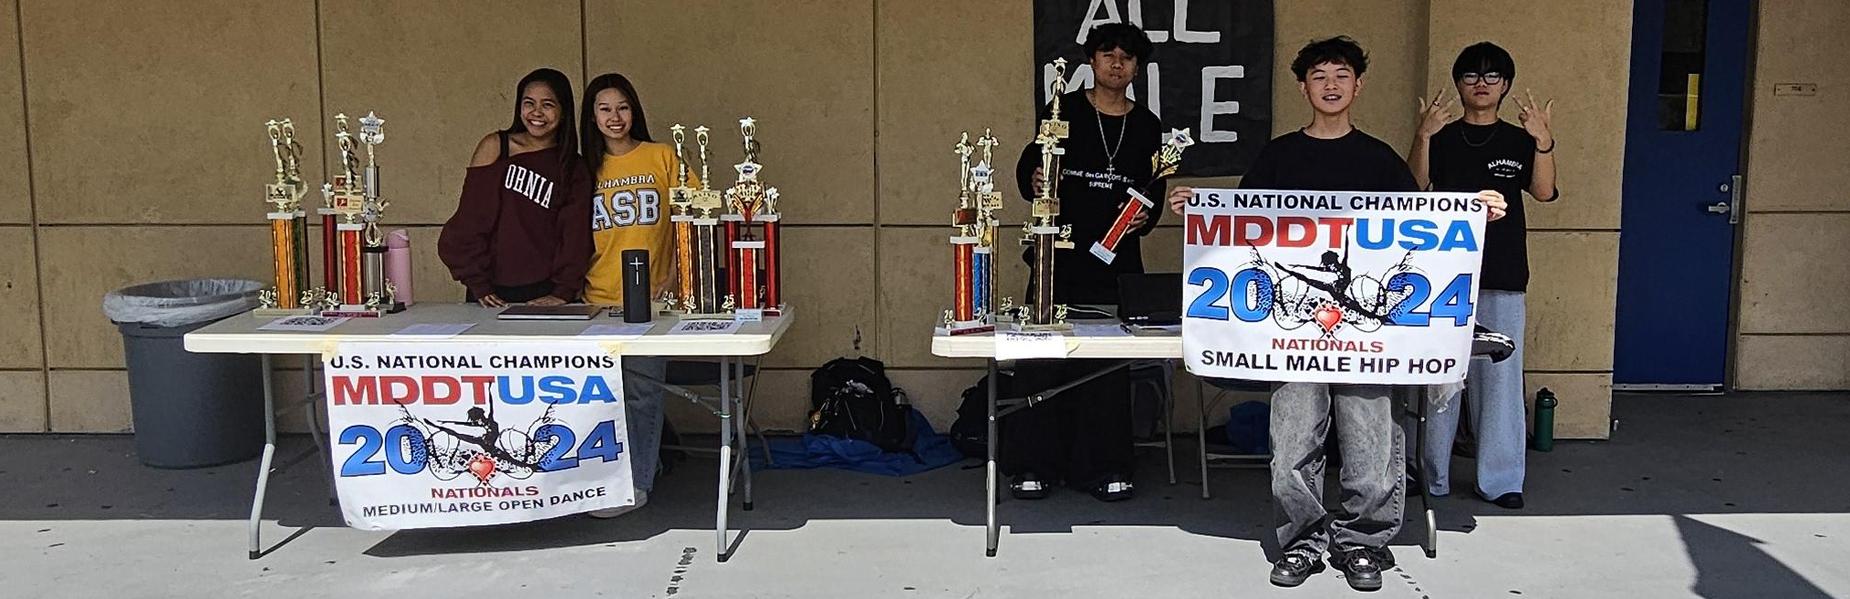
Community Schools Fair - Small All Male
(photo courtesy of Jacob Rojas)
(photo courtesy of Jacob Rojas)
(photo courtesy of Jacob Rojas)
(photo courtesy of Jacob Rojas)
(photo courtesy of Jacob Rojas)
(photo courtesy of Jacob Rojas)
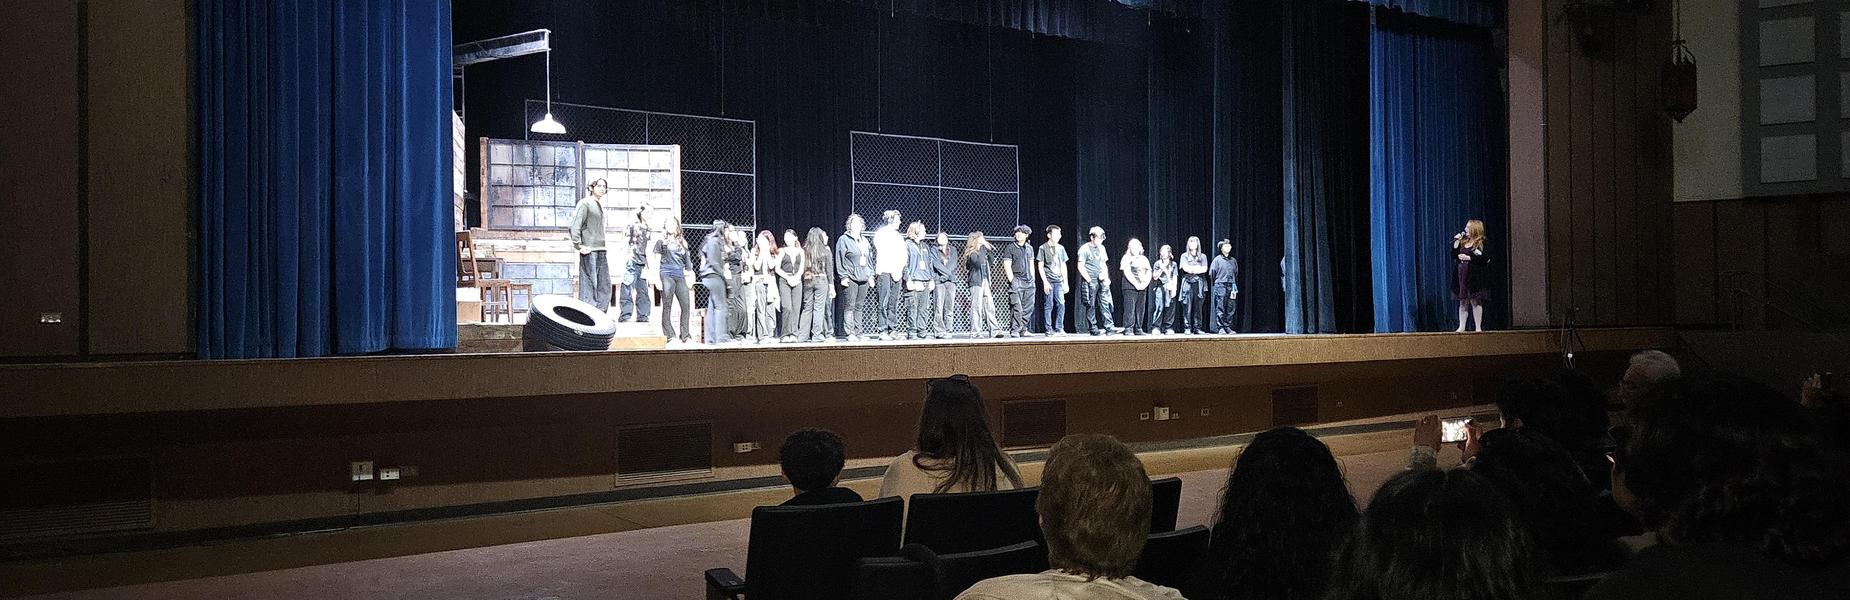
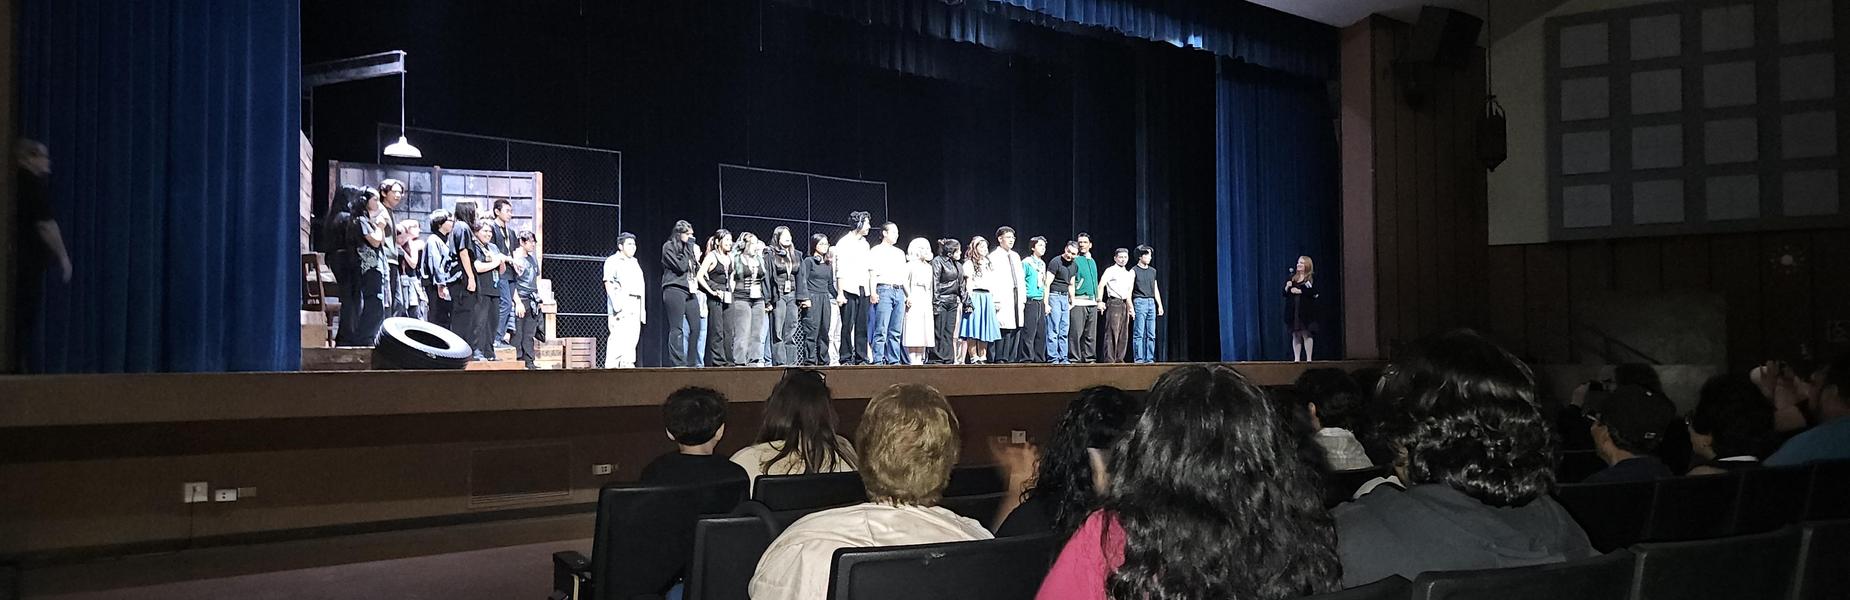
Senior Cast and Crew for "The Outsiders"
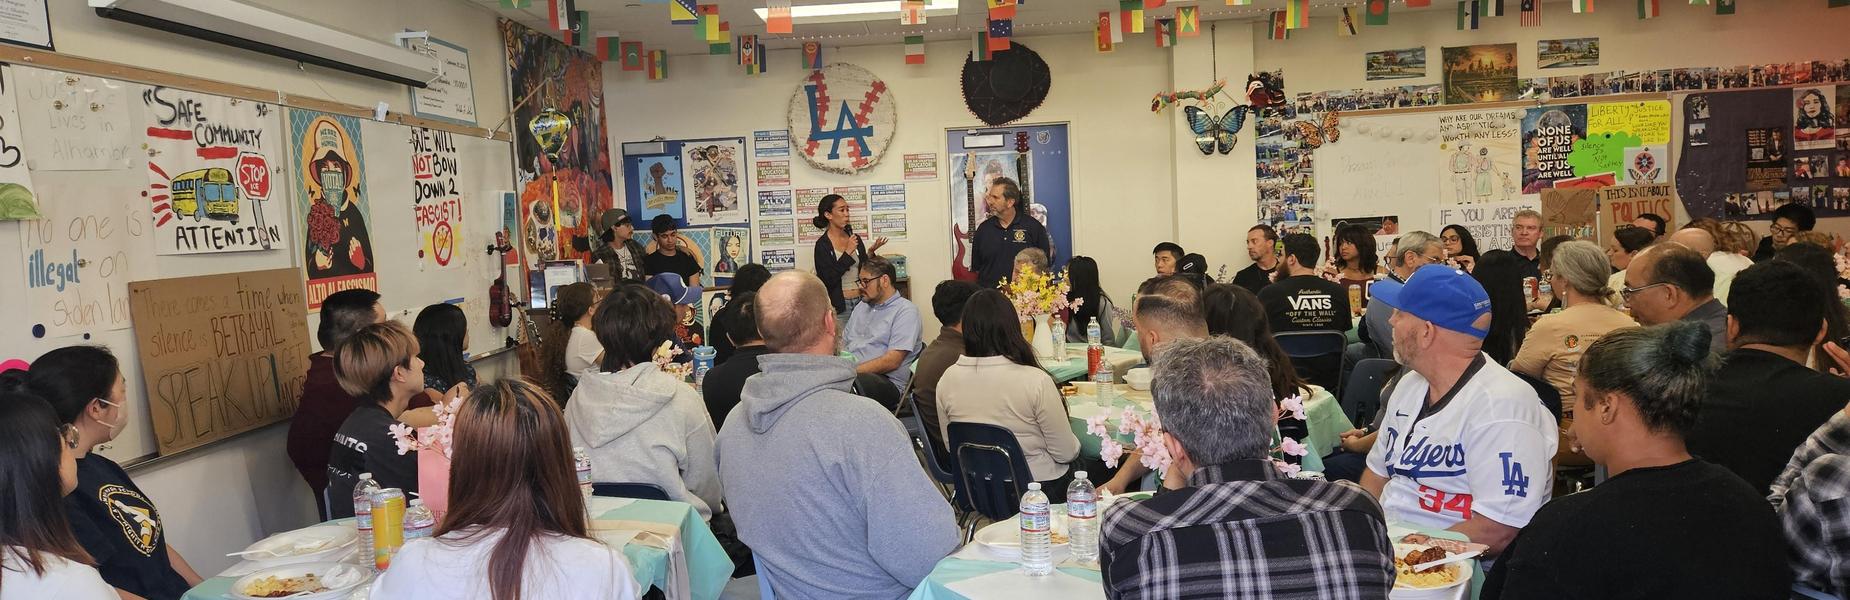
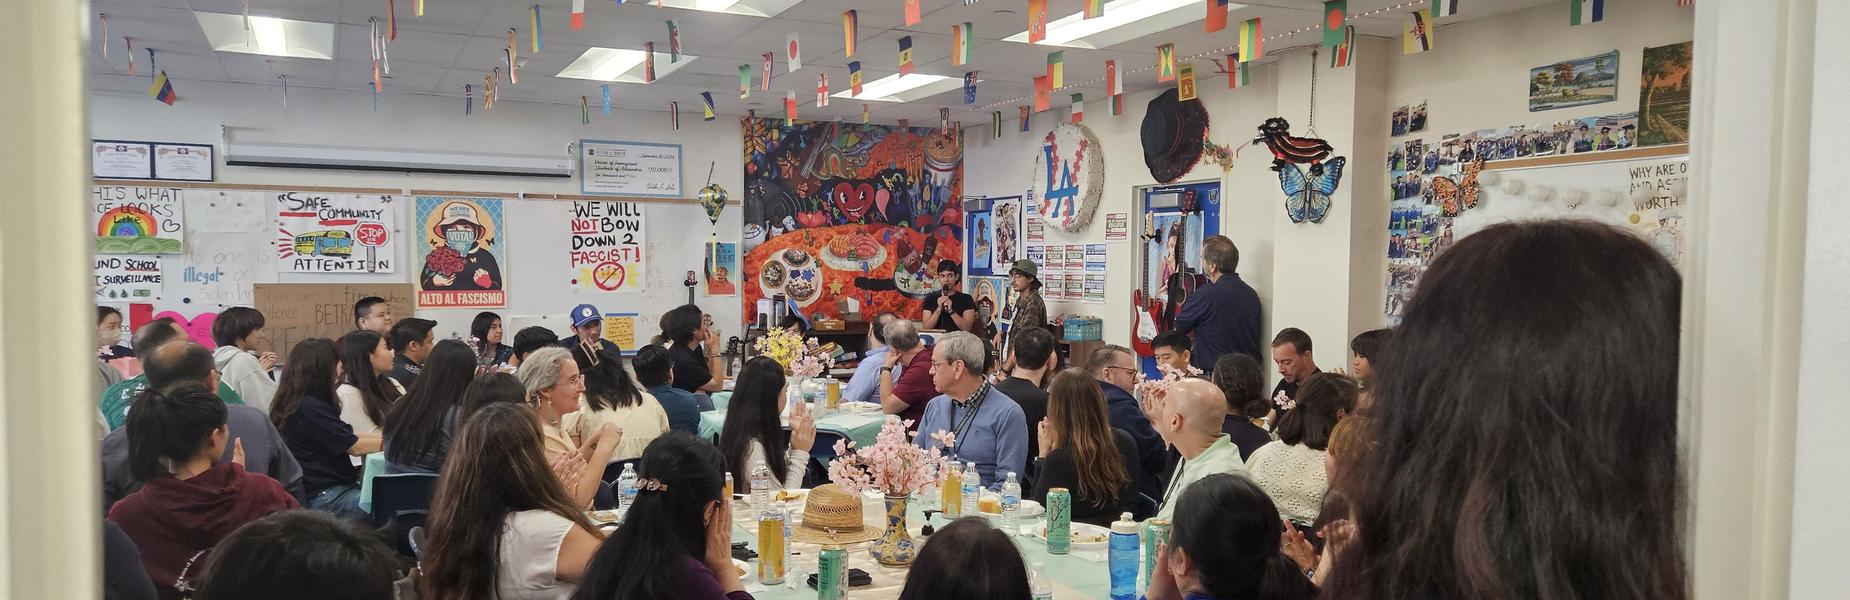
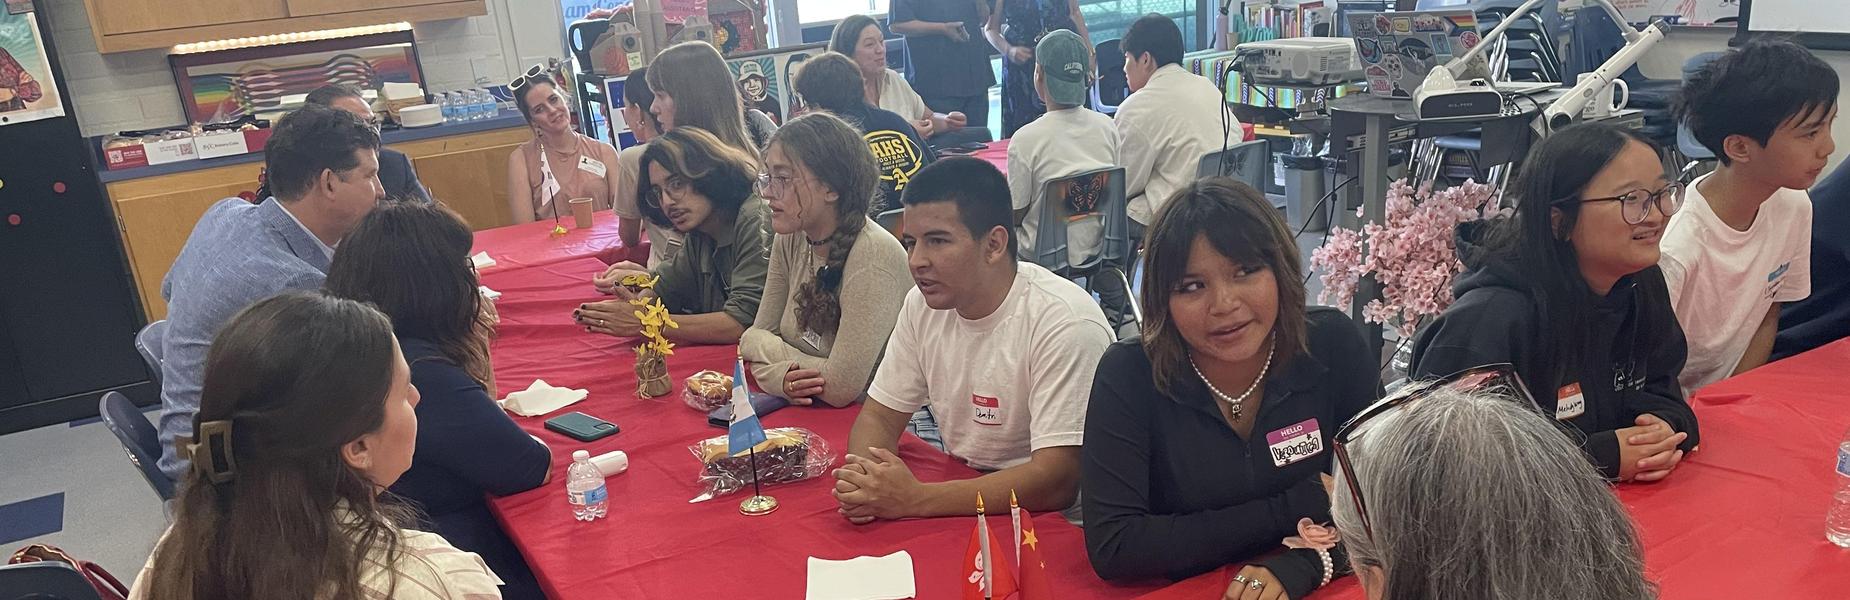
Dream Center Ally Luncheon
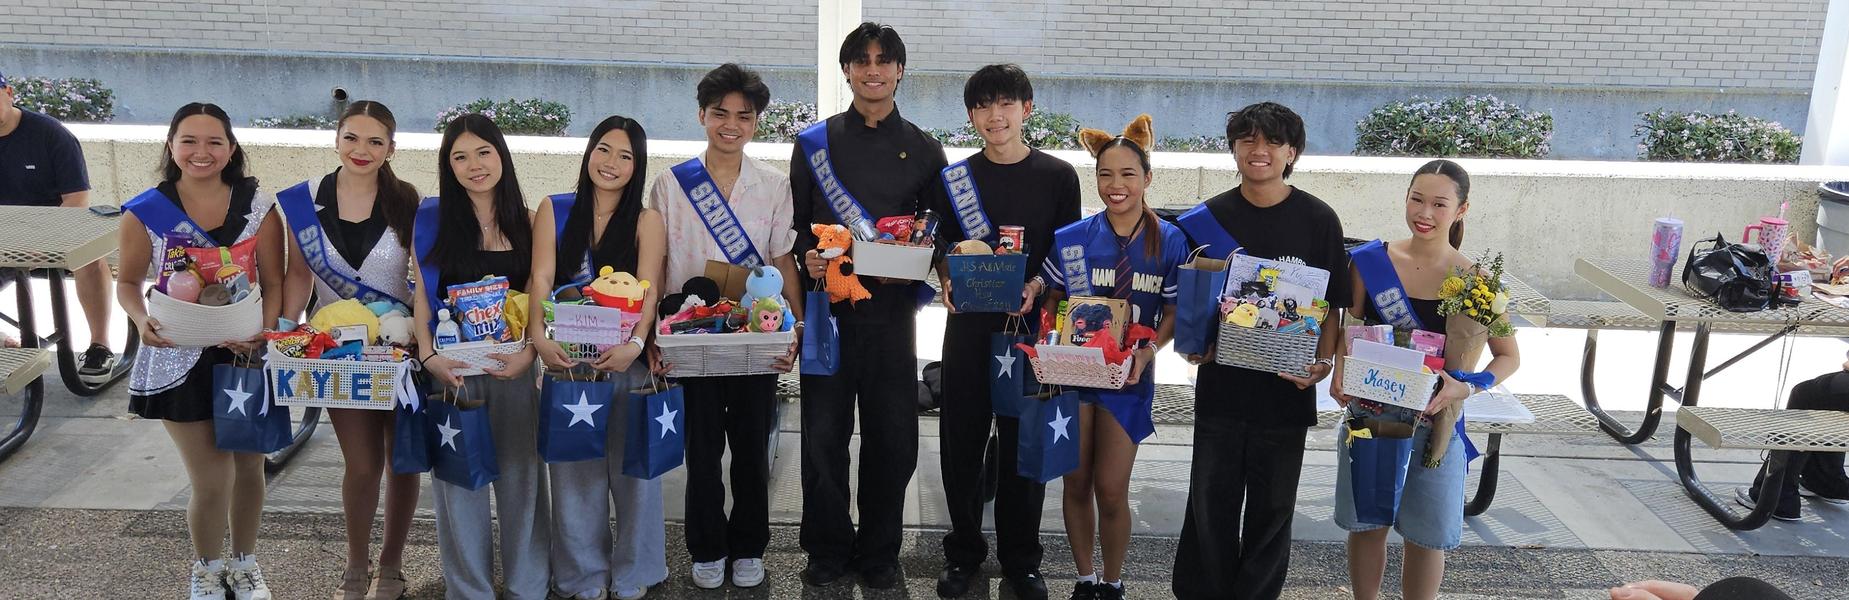
Aliso Dance Classic Finals Senior Nite
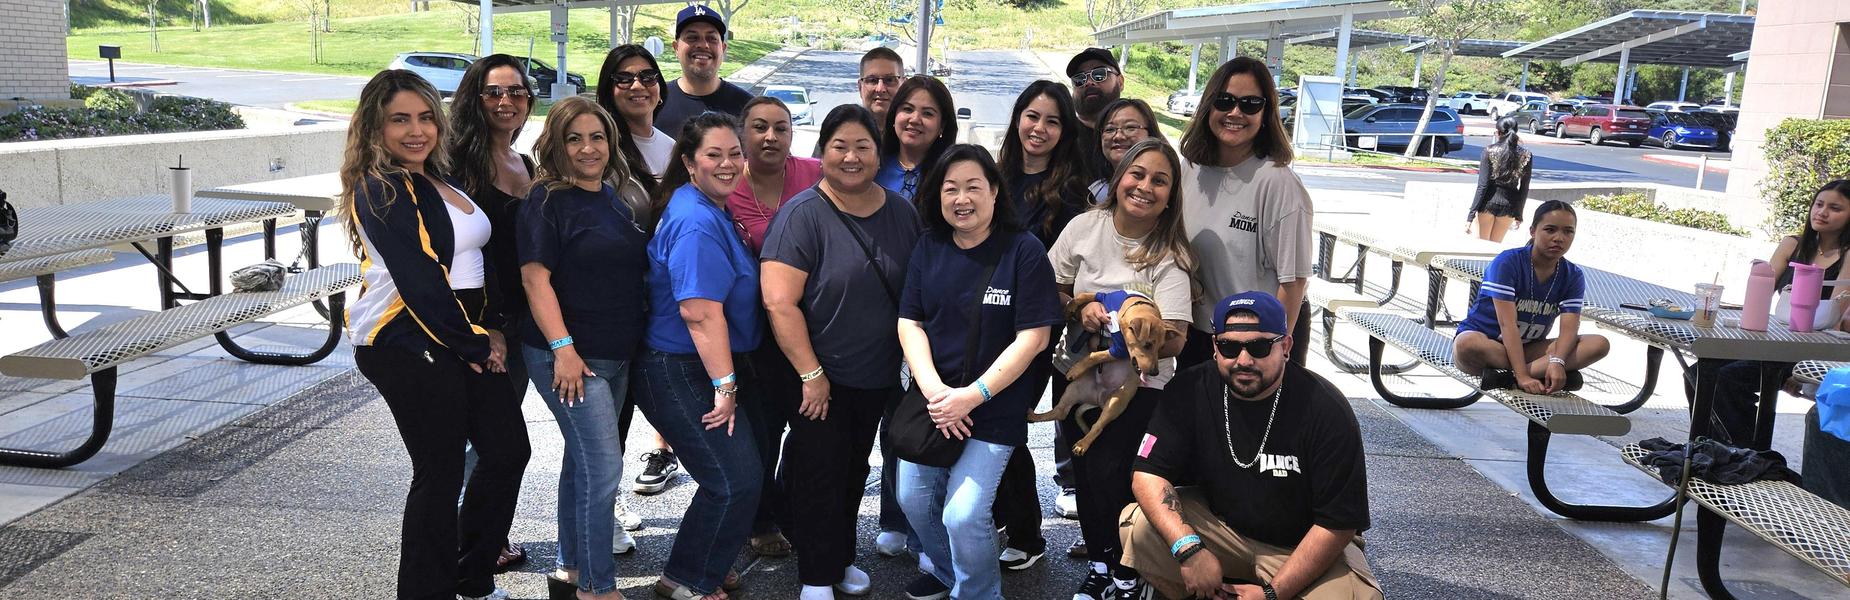
Dance Team Parents prior to winning the 'Participation in the Stands' Trophy at Aliso Dance Classic Finals!
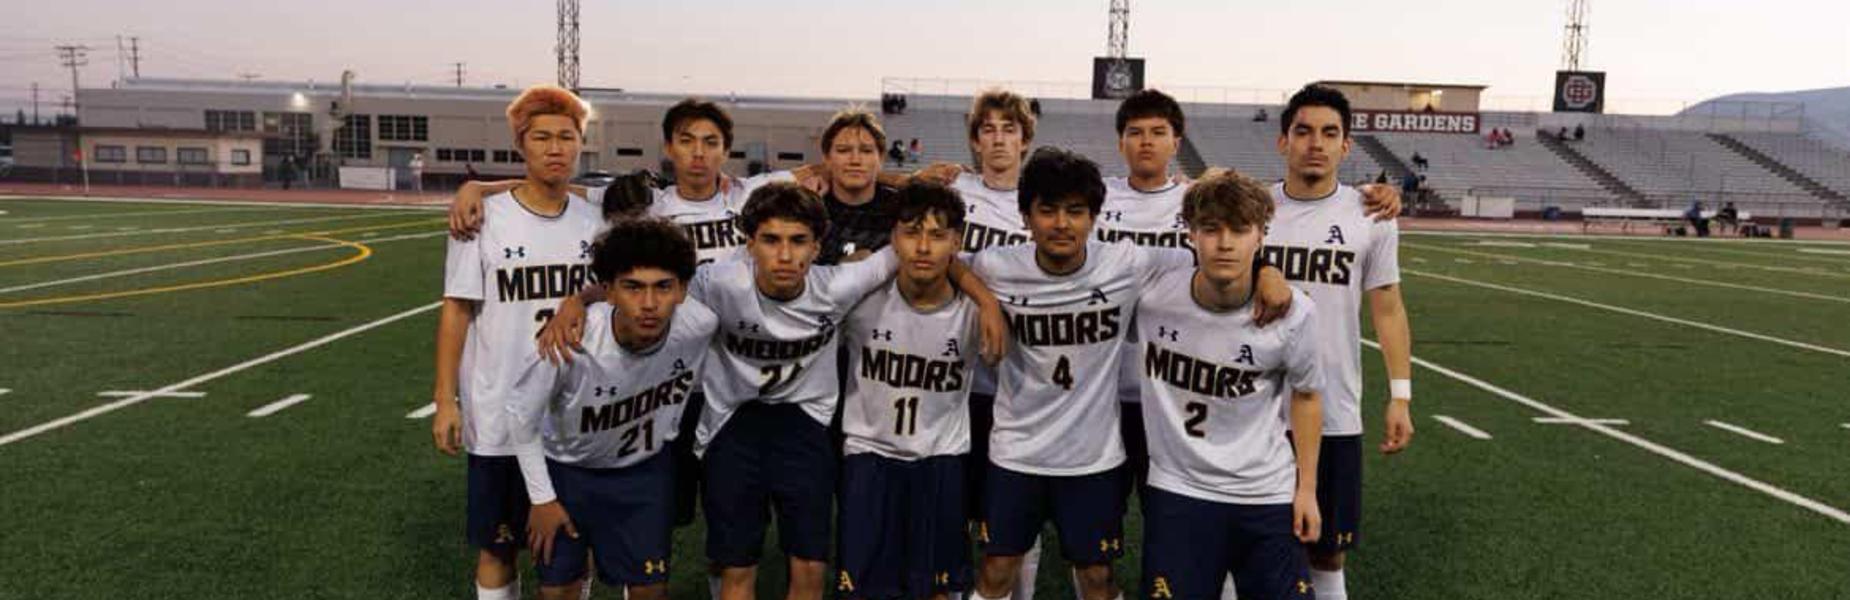
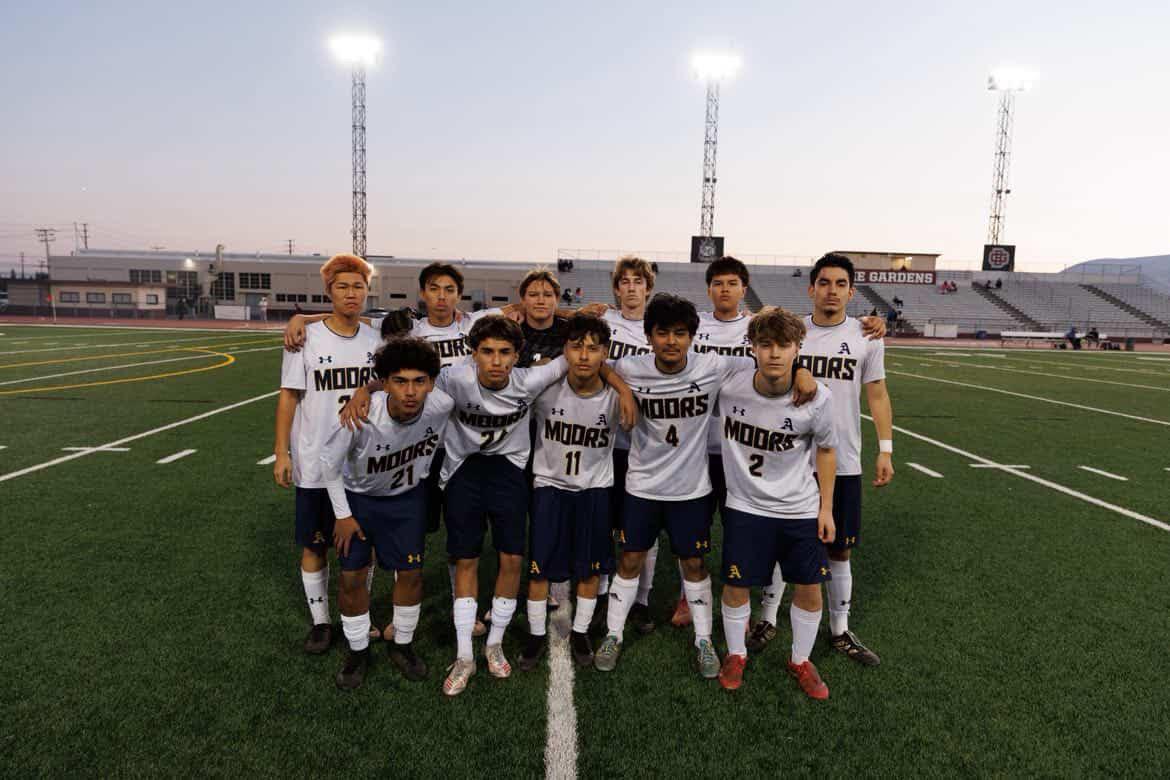
Congrats to the AHS Boys Varsity Soccer Team for winning the Almont league - the first itme in 40 years!
Celebration of Learning

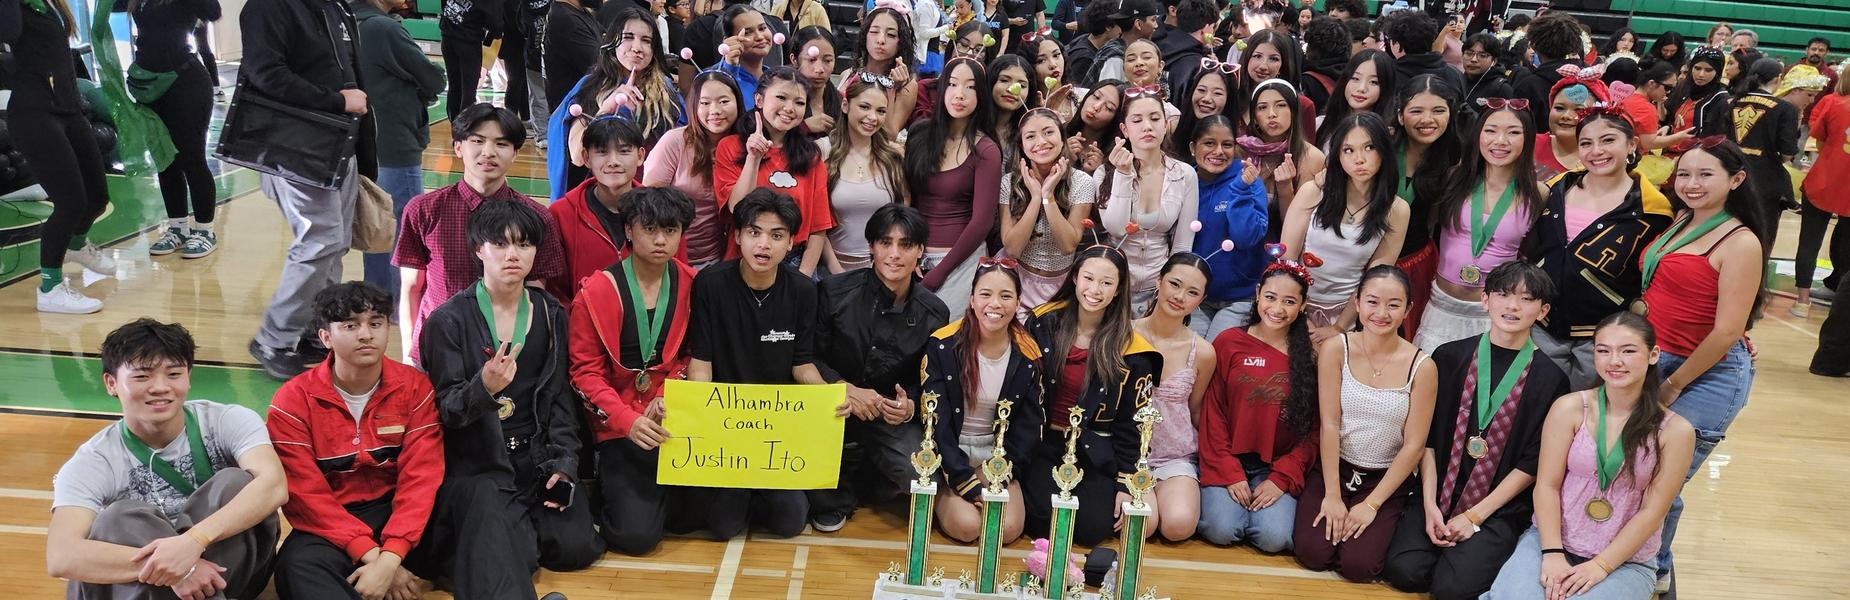
AHS Dance Team and All Male at the Thousand Oaks Dance Challenge
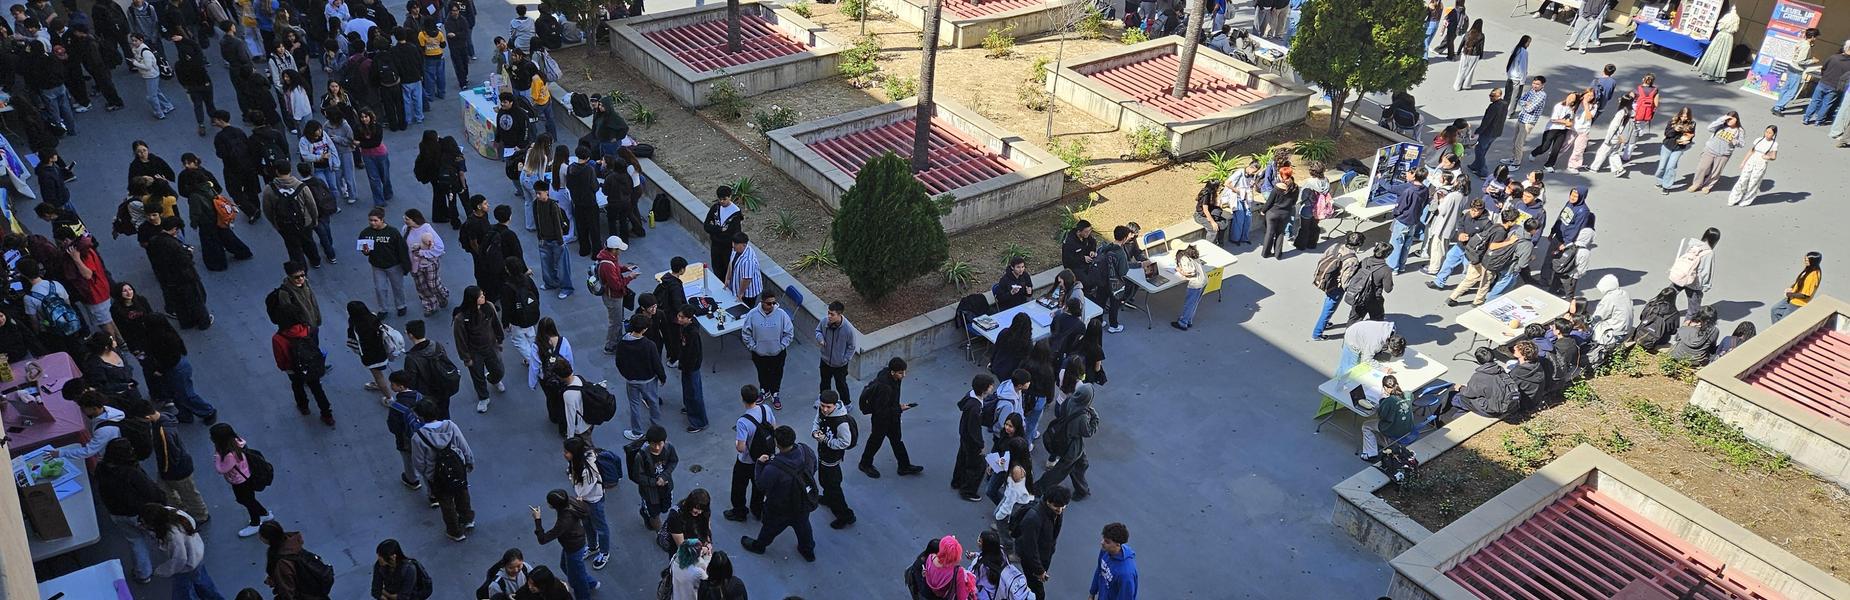
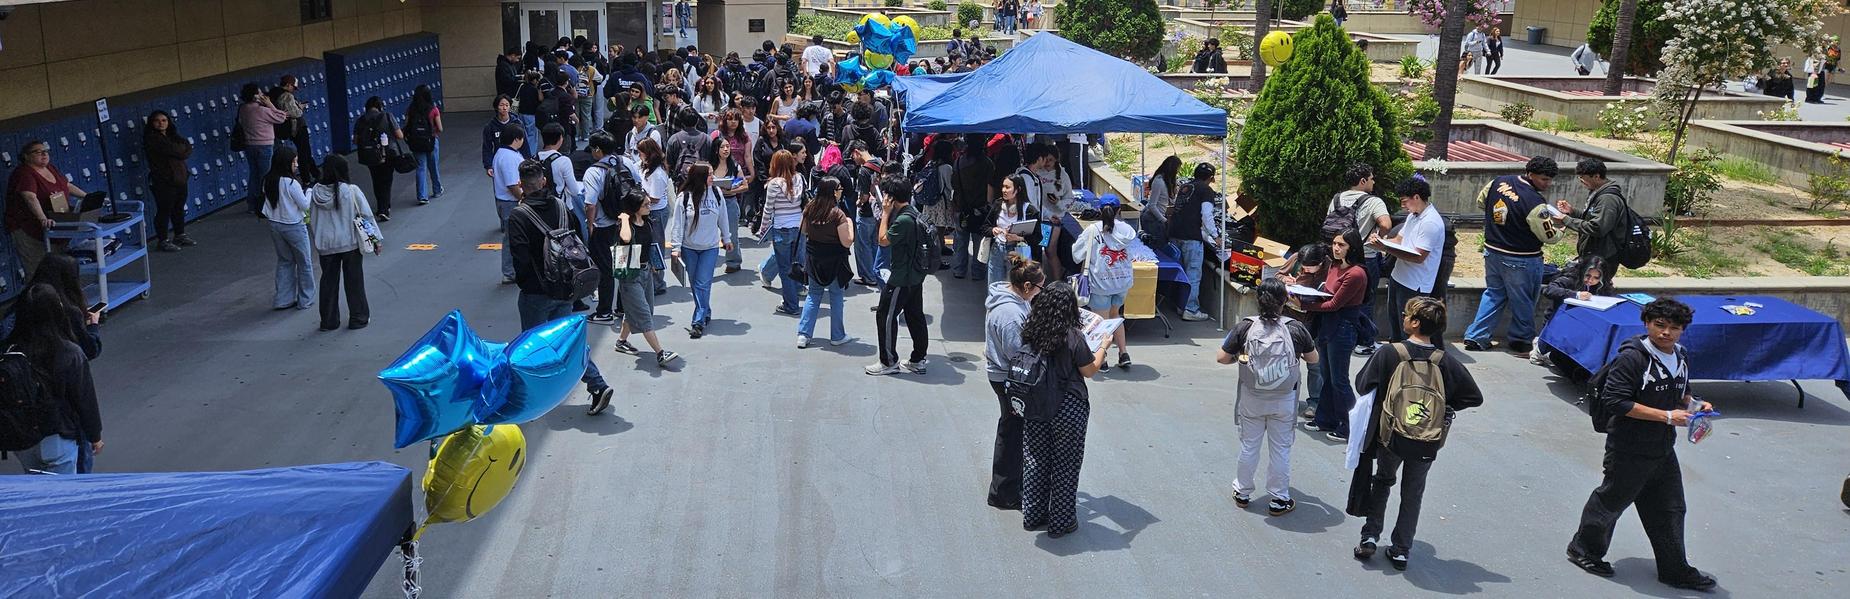
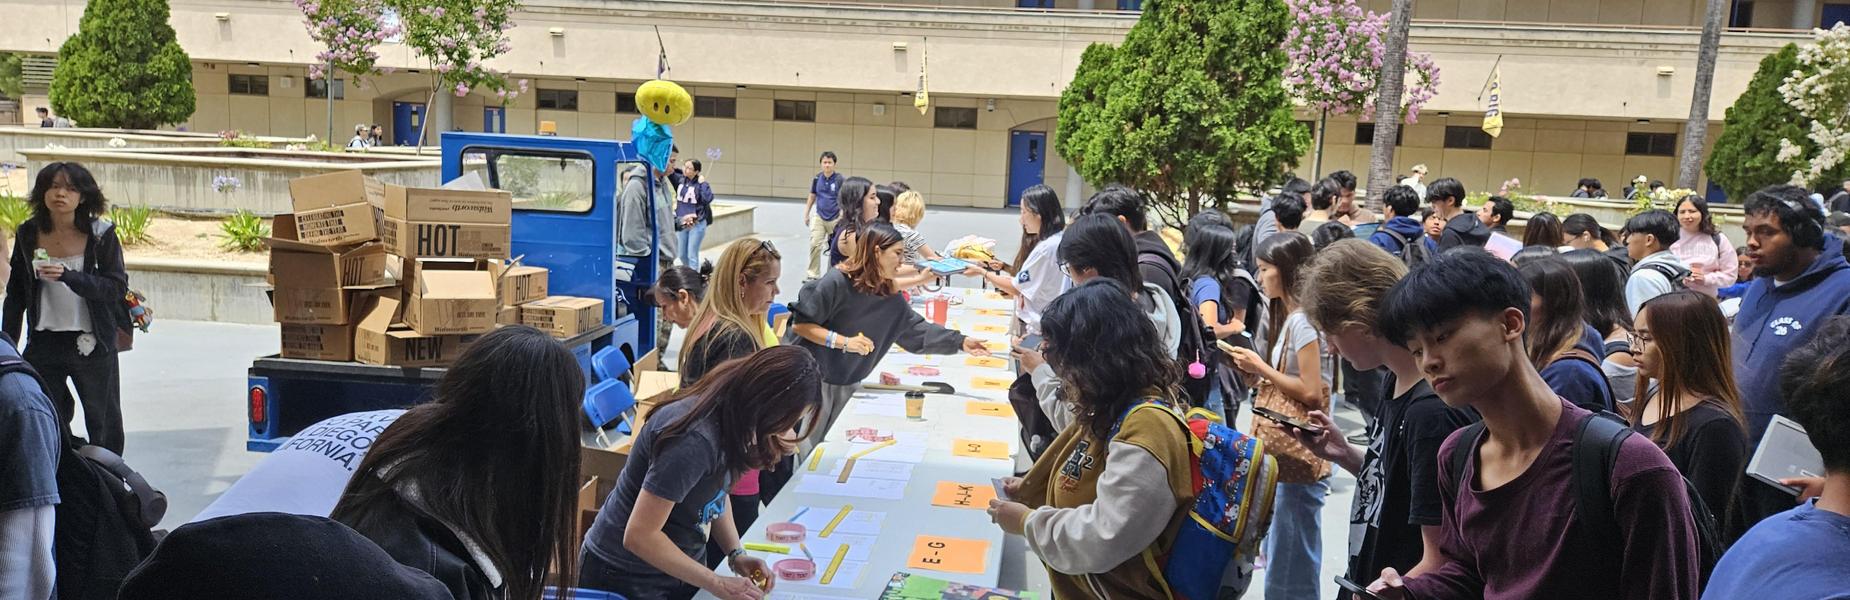
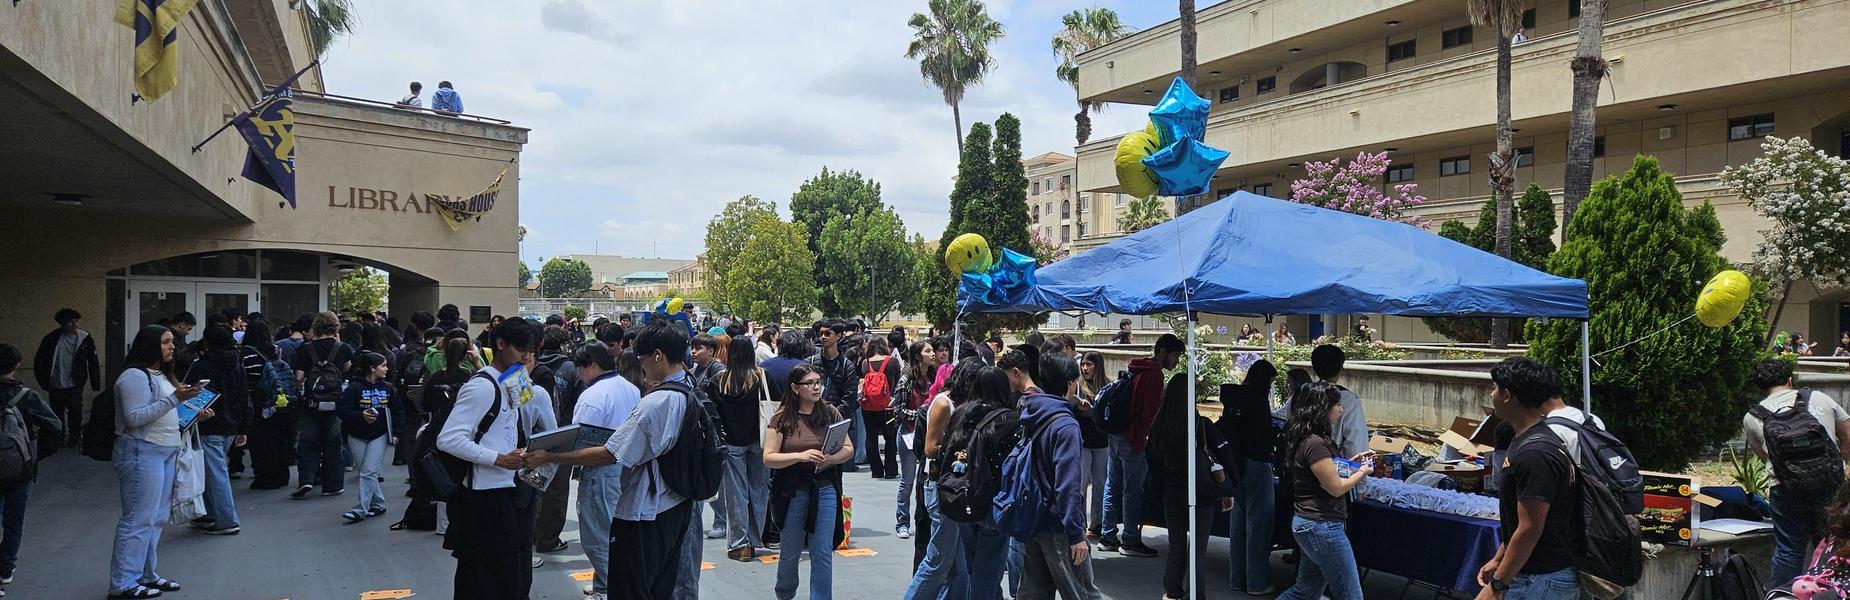
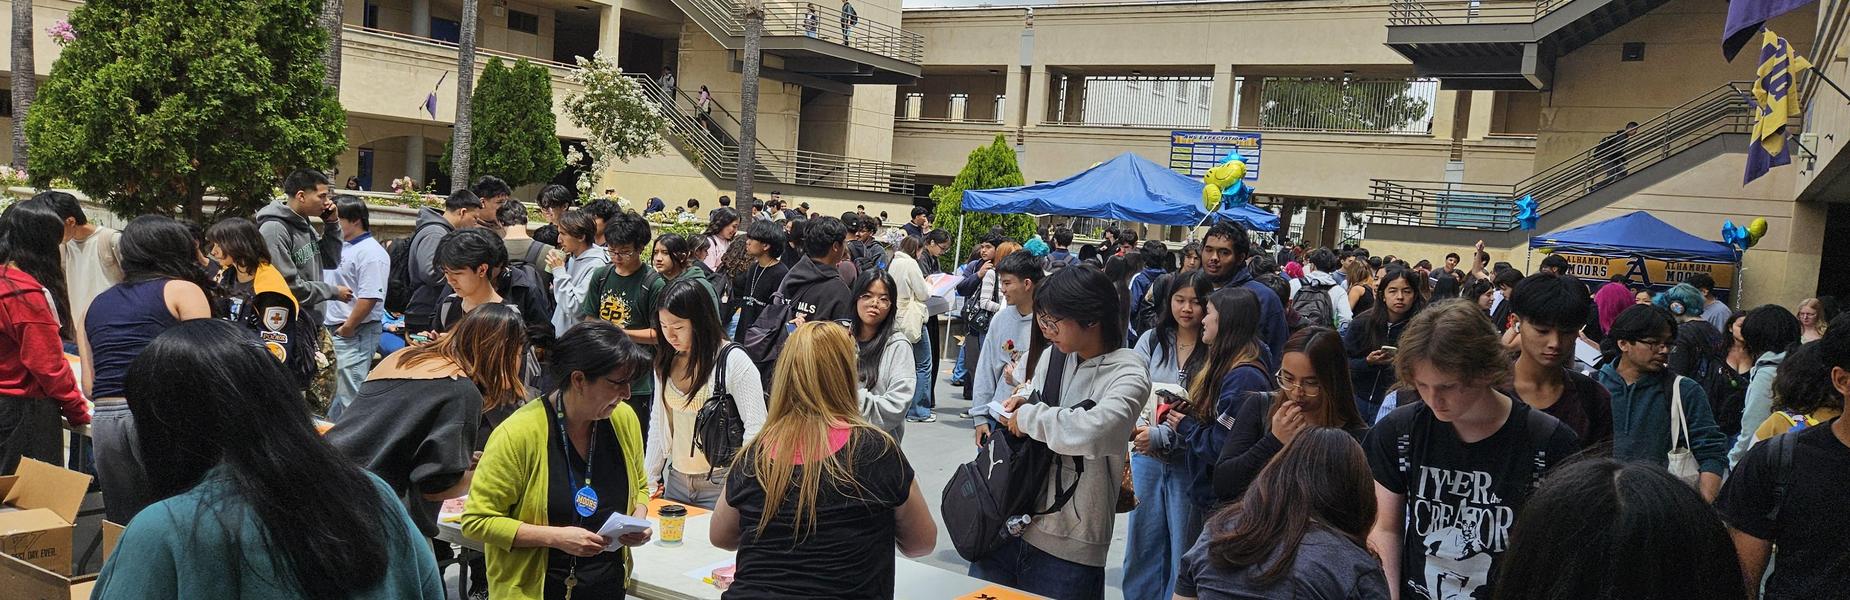
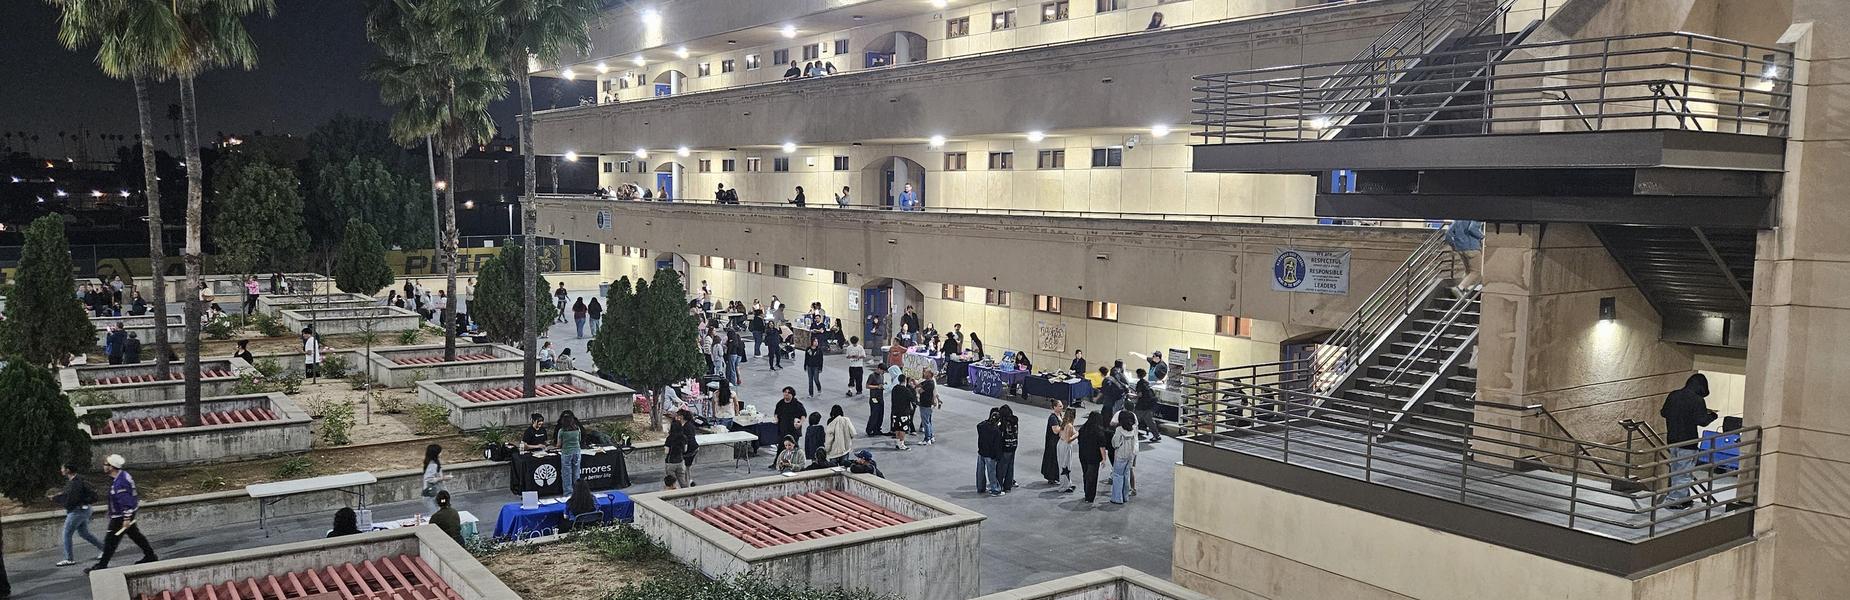
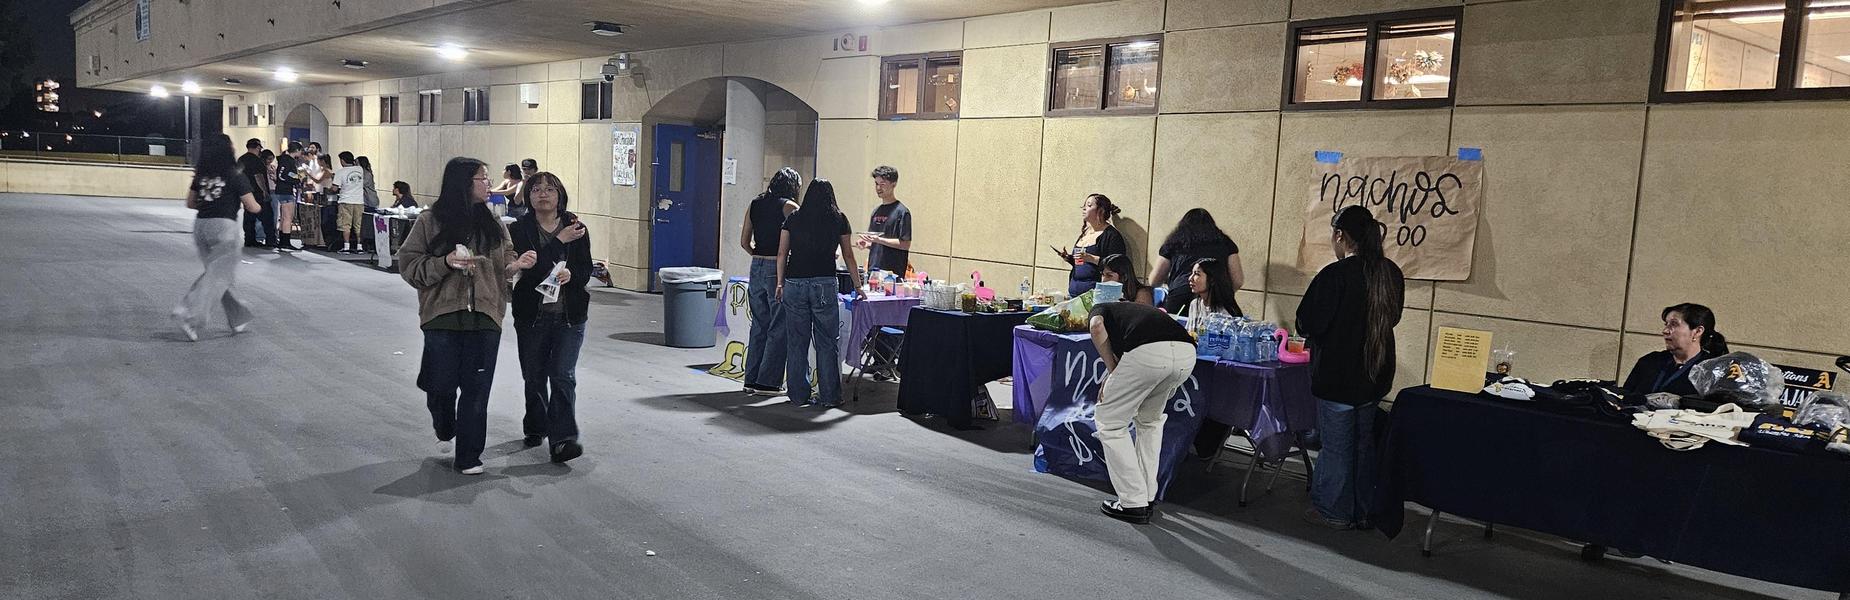
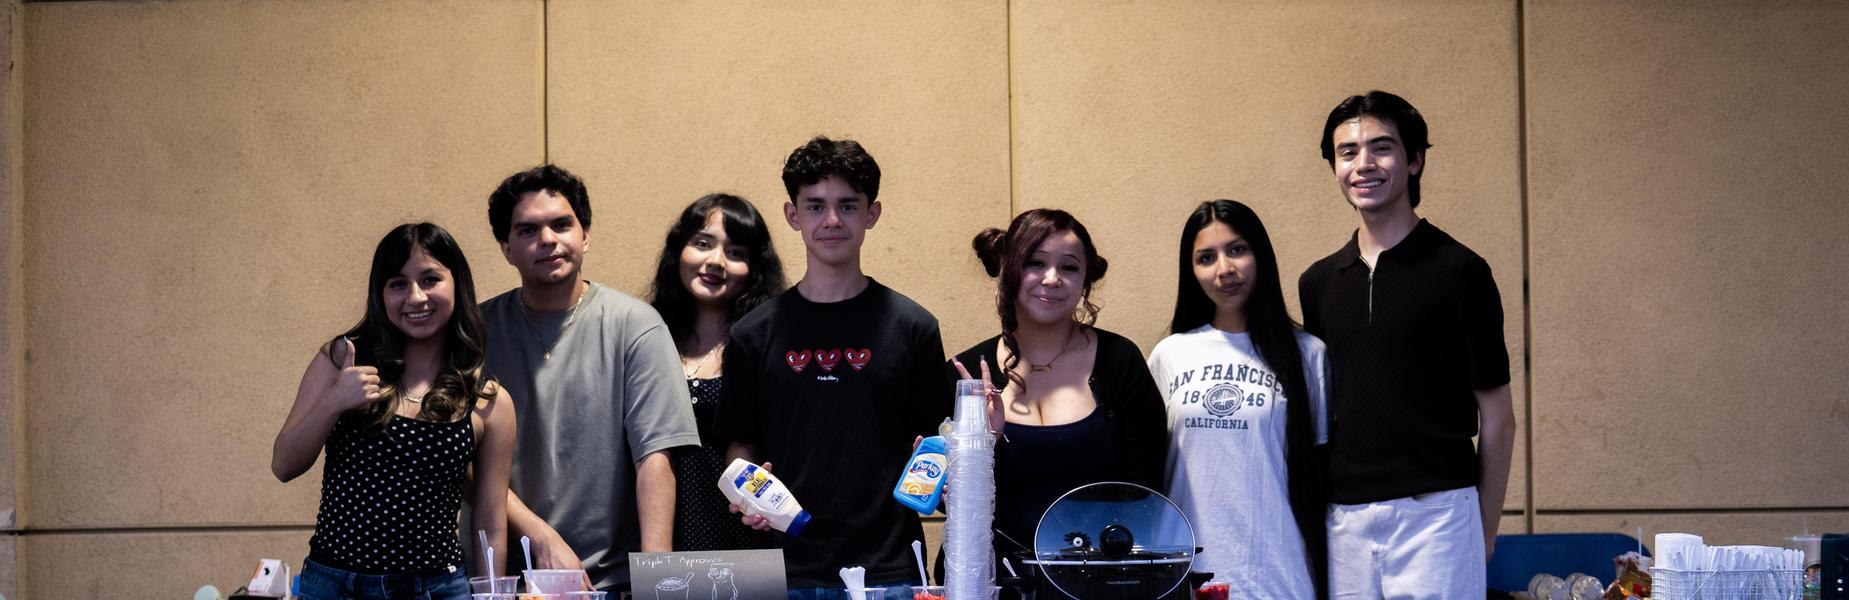
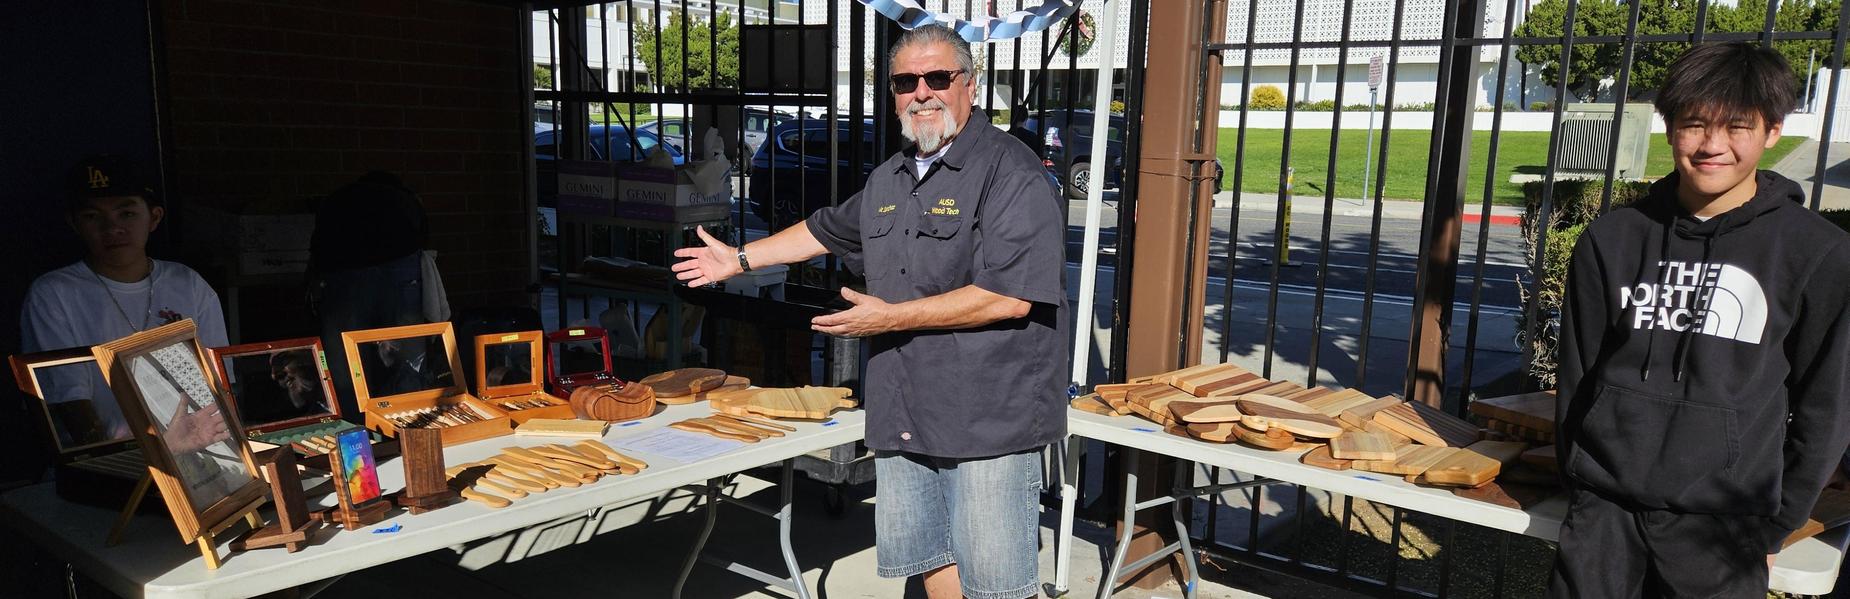
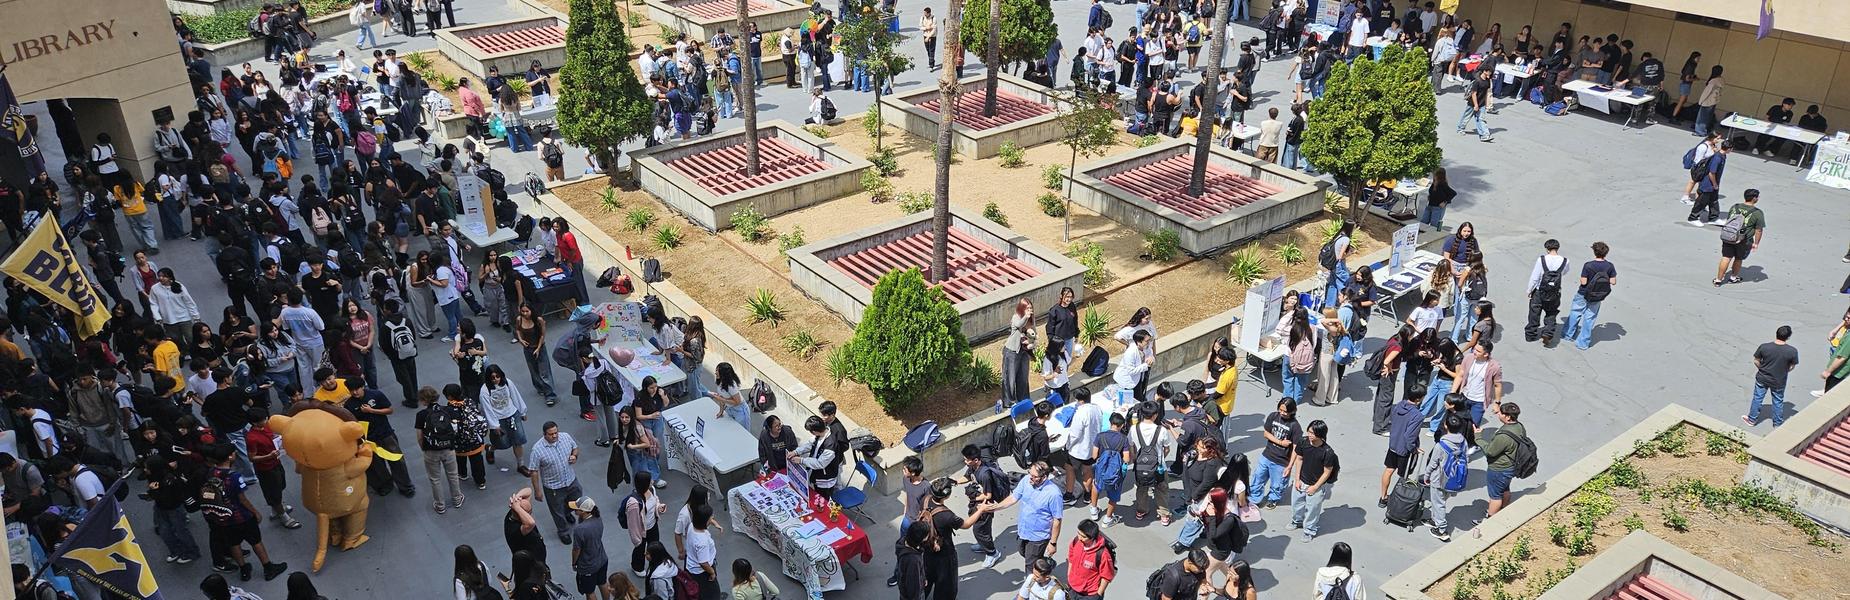
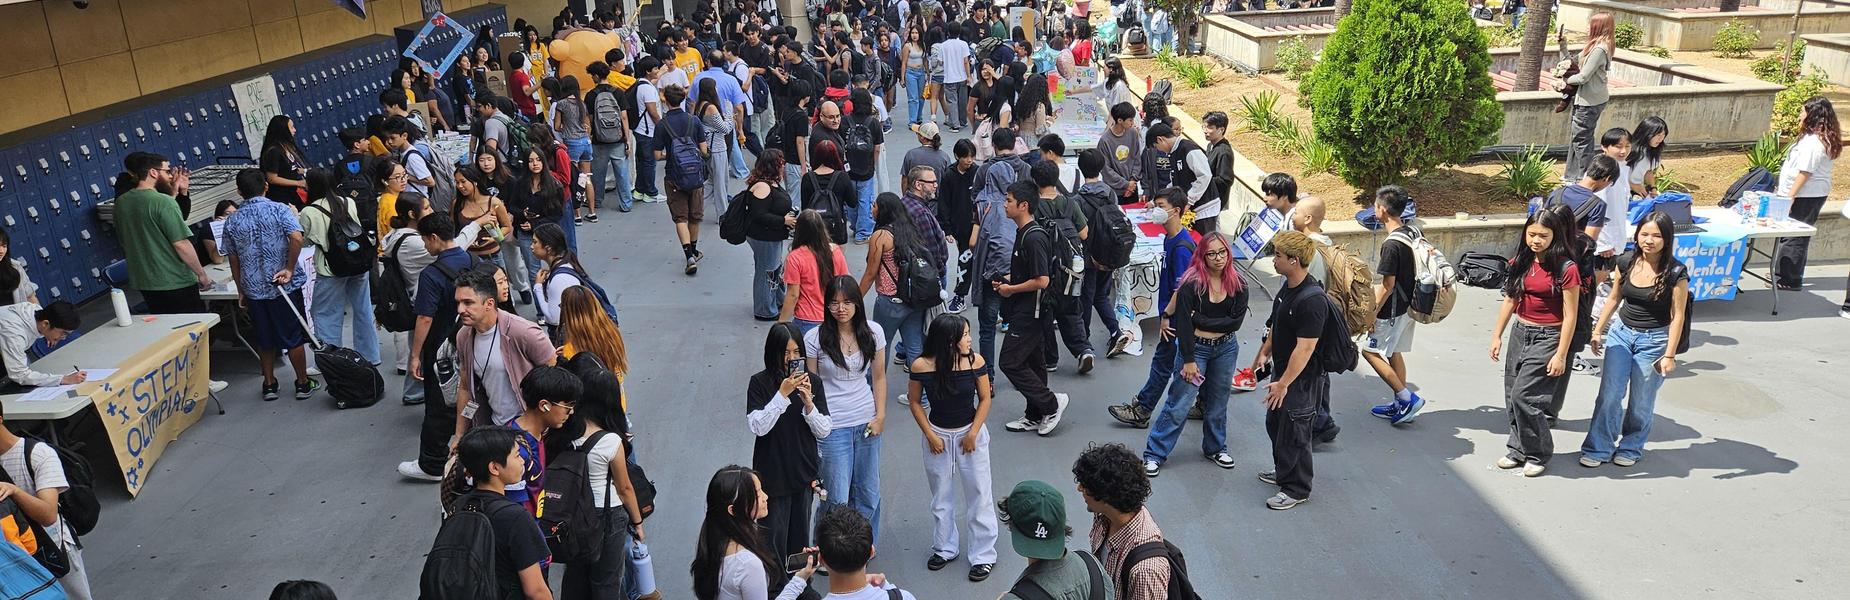
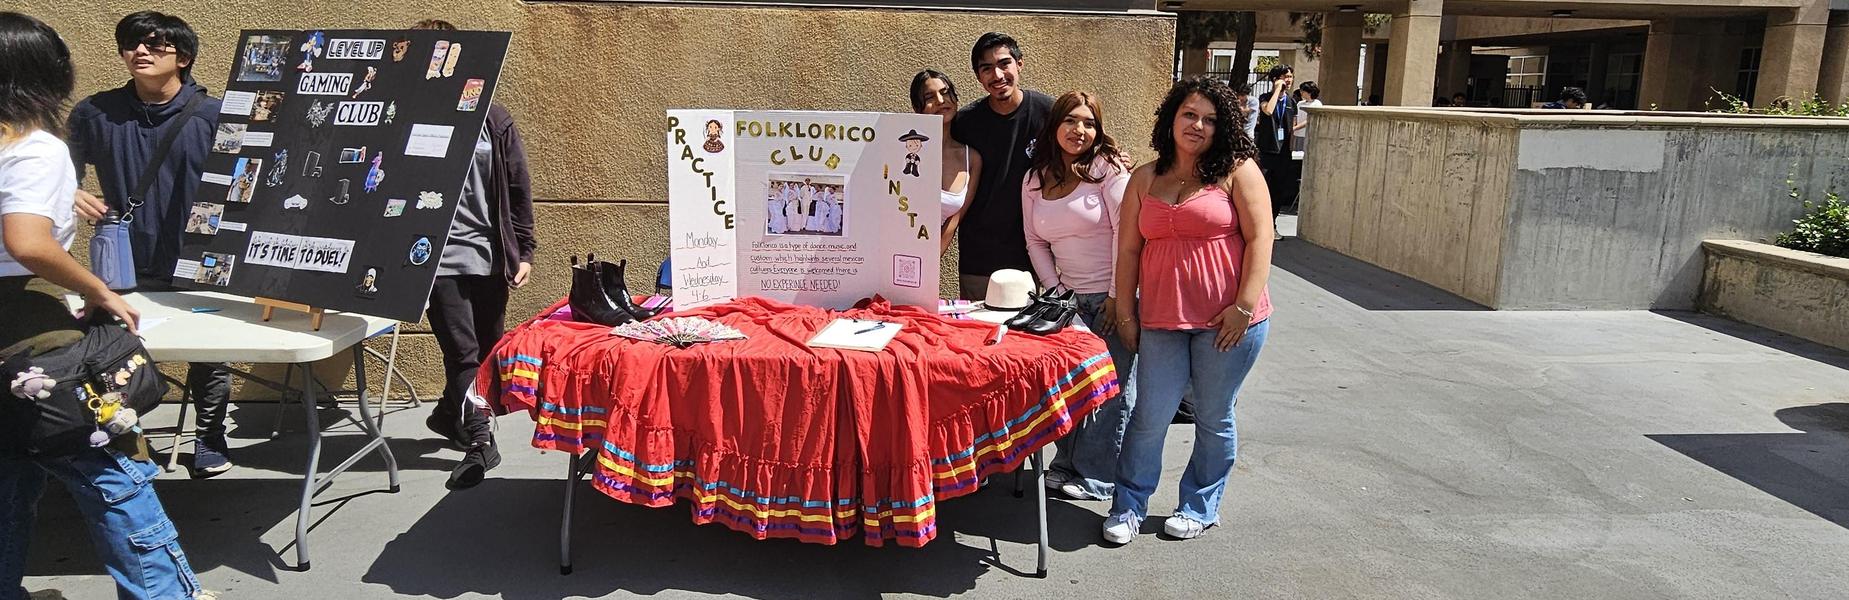
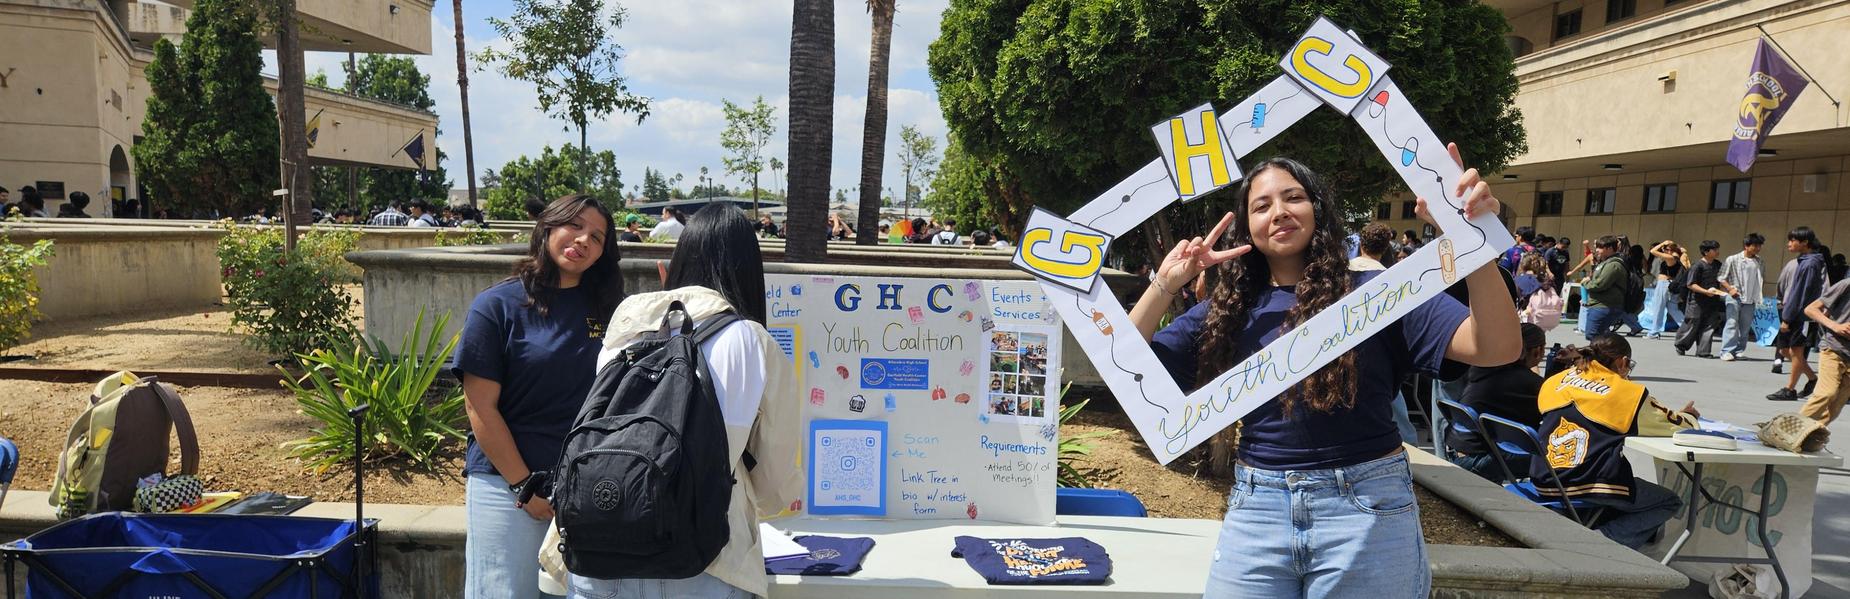
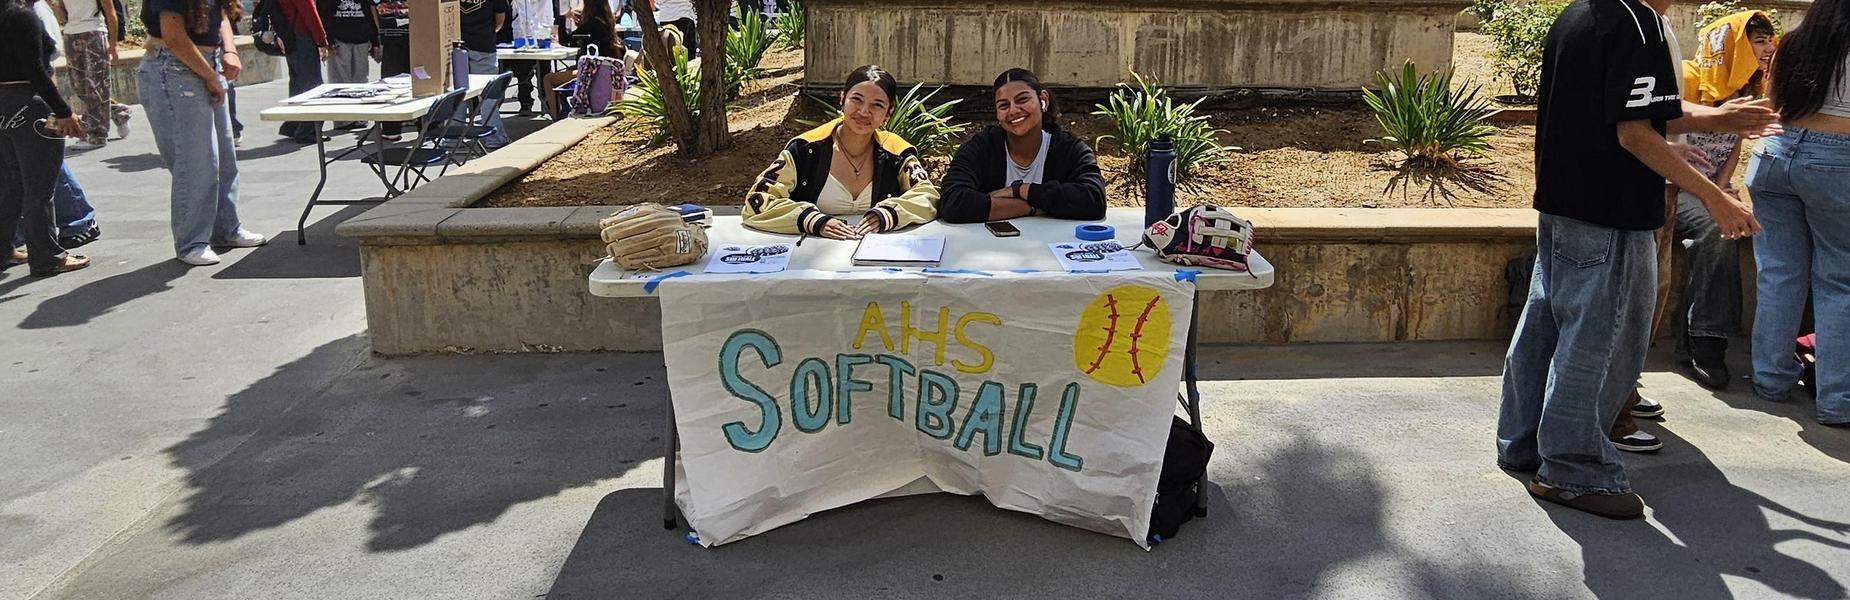
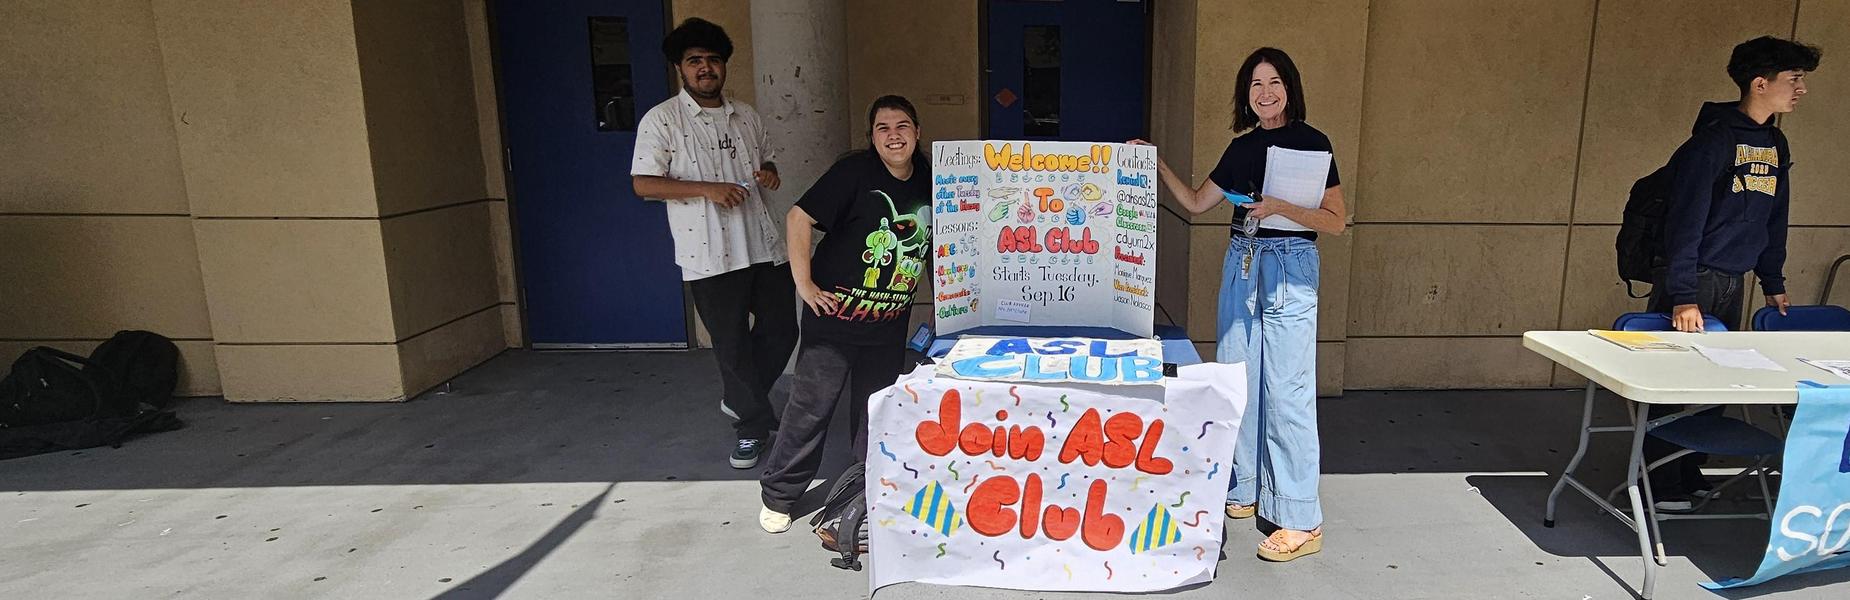
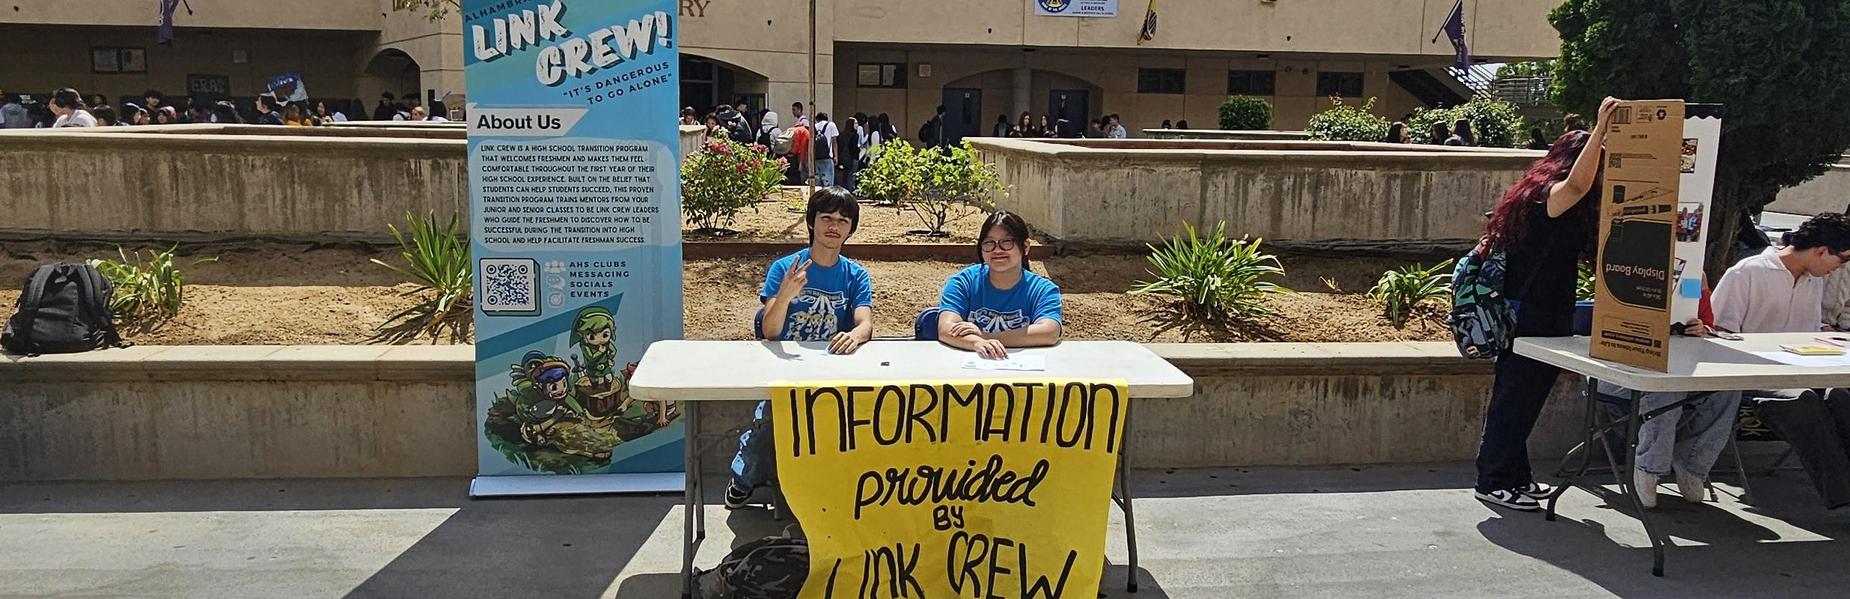
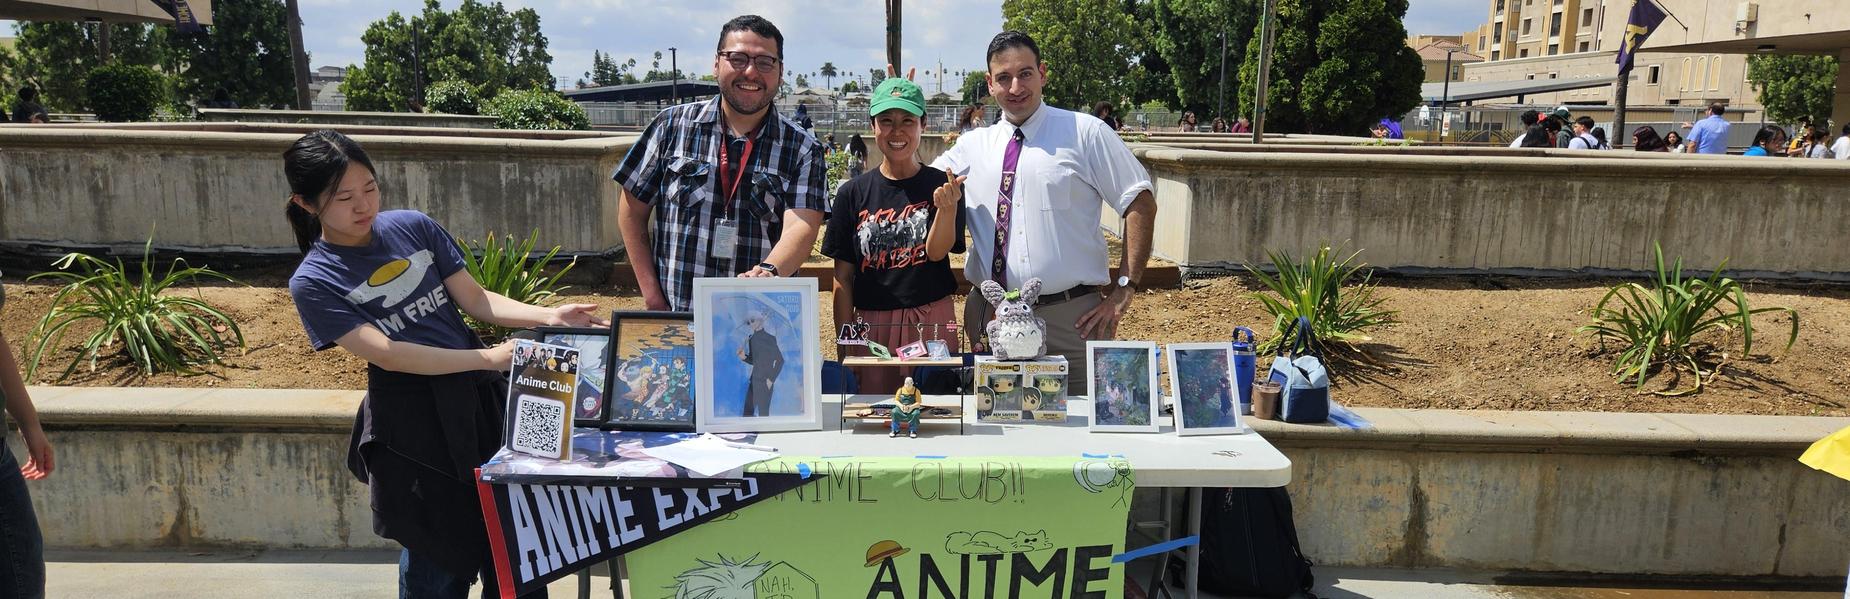
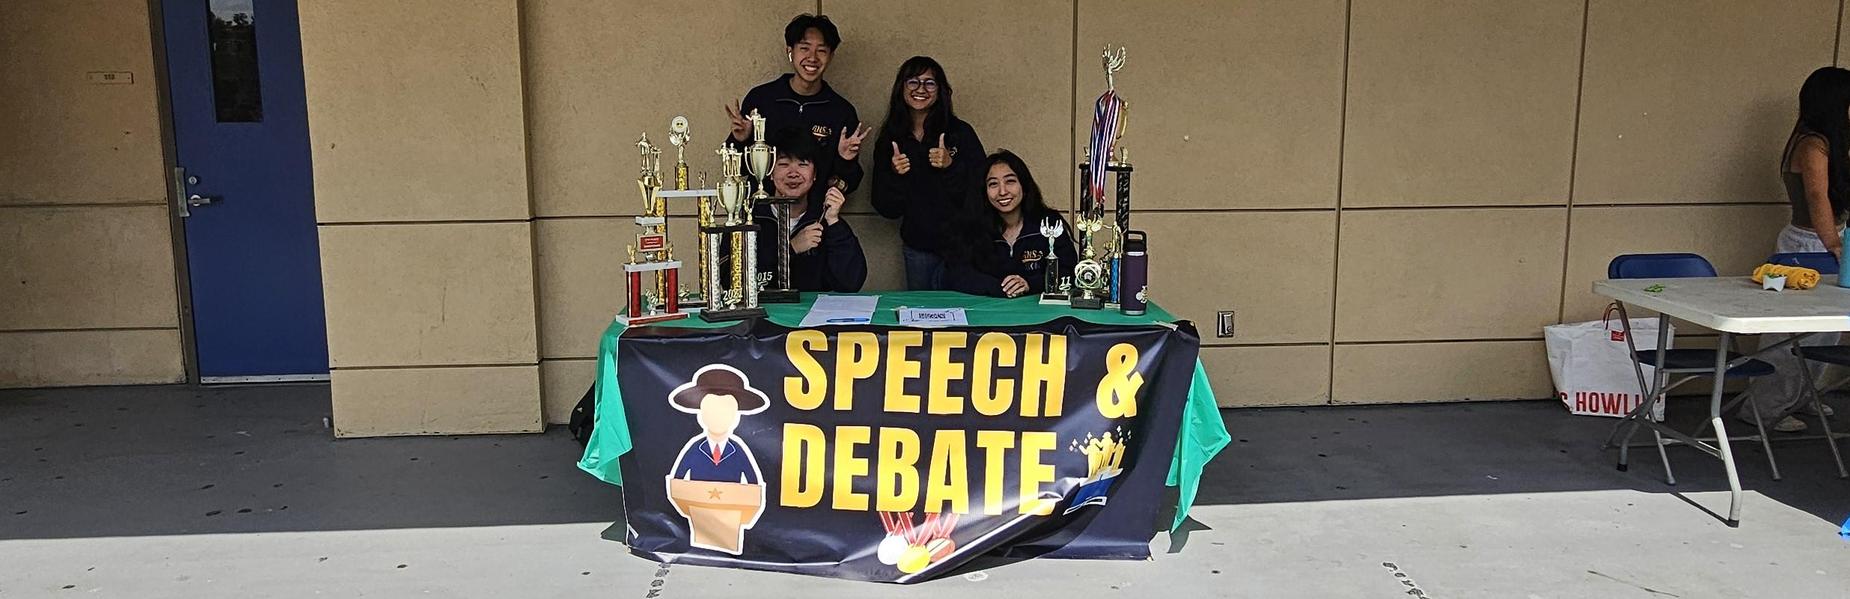
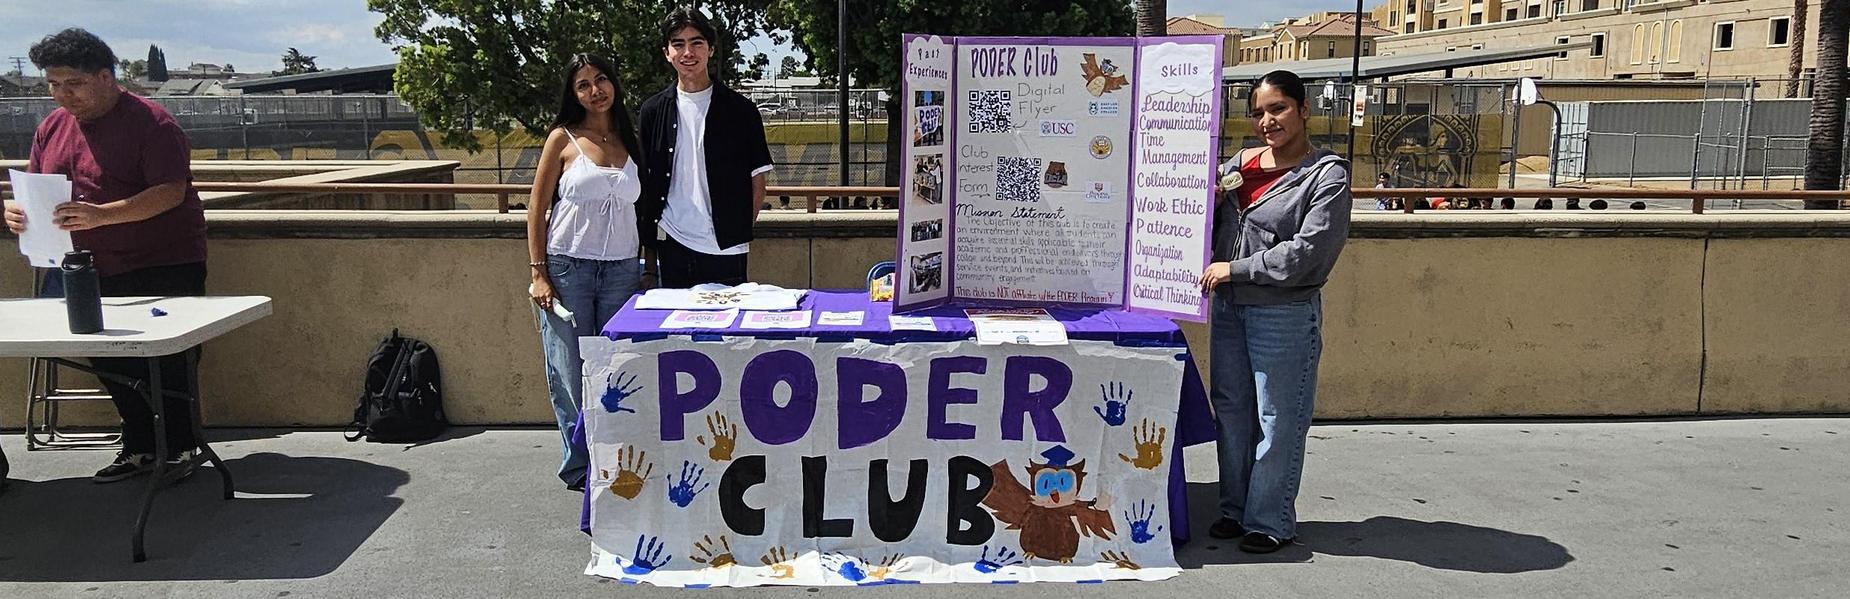
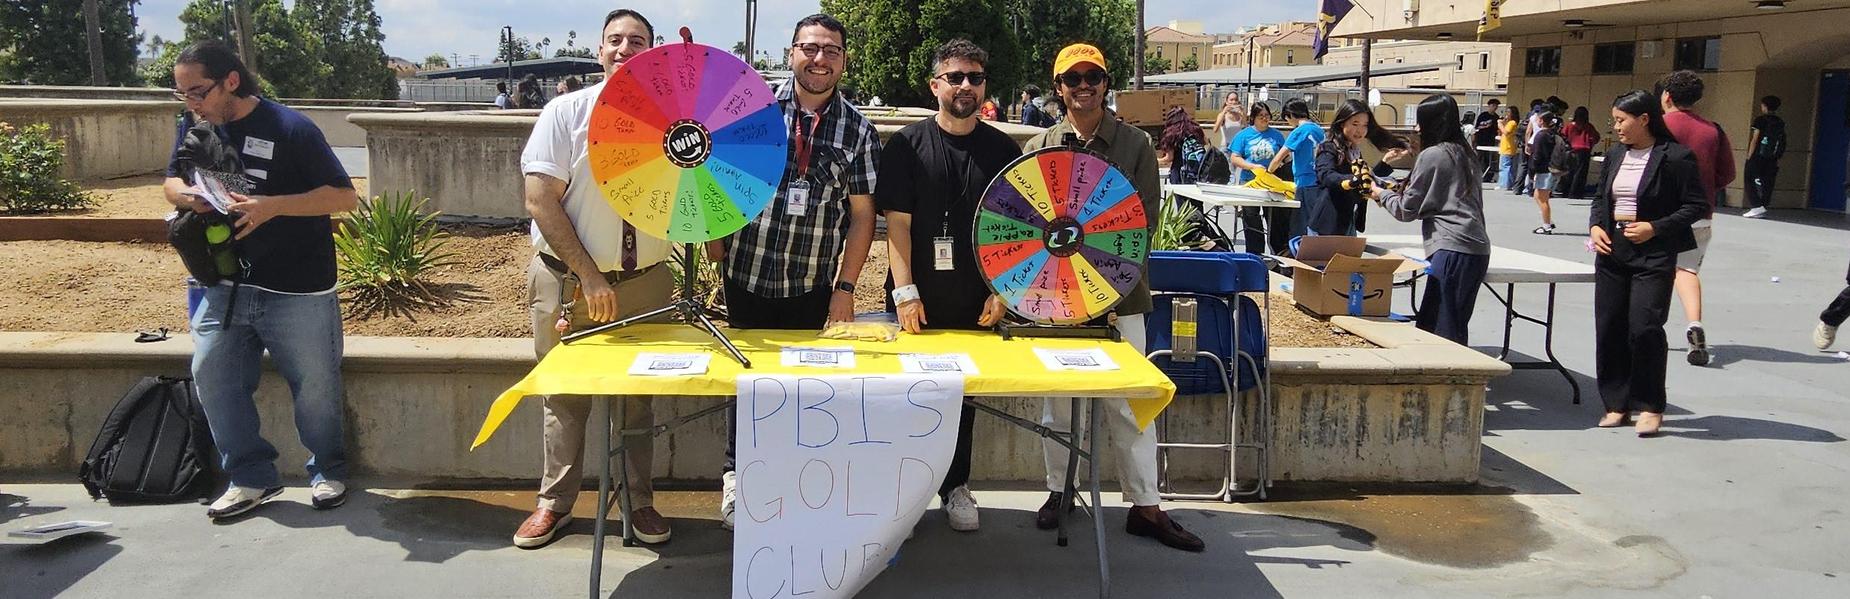
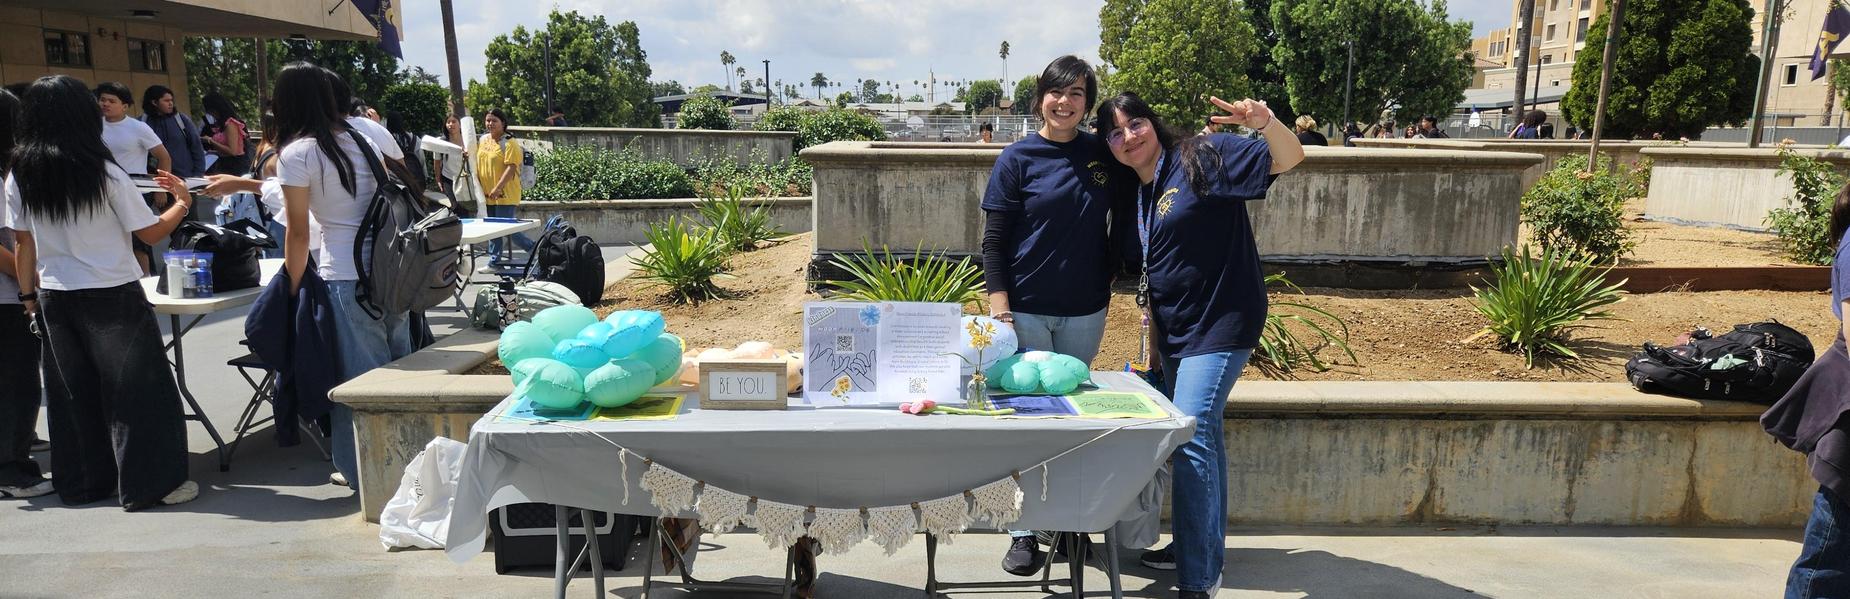
Annual Club Fair
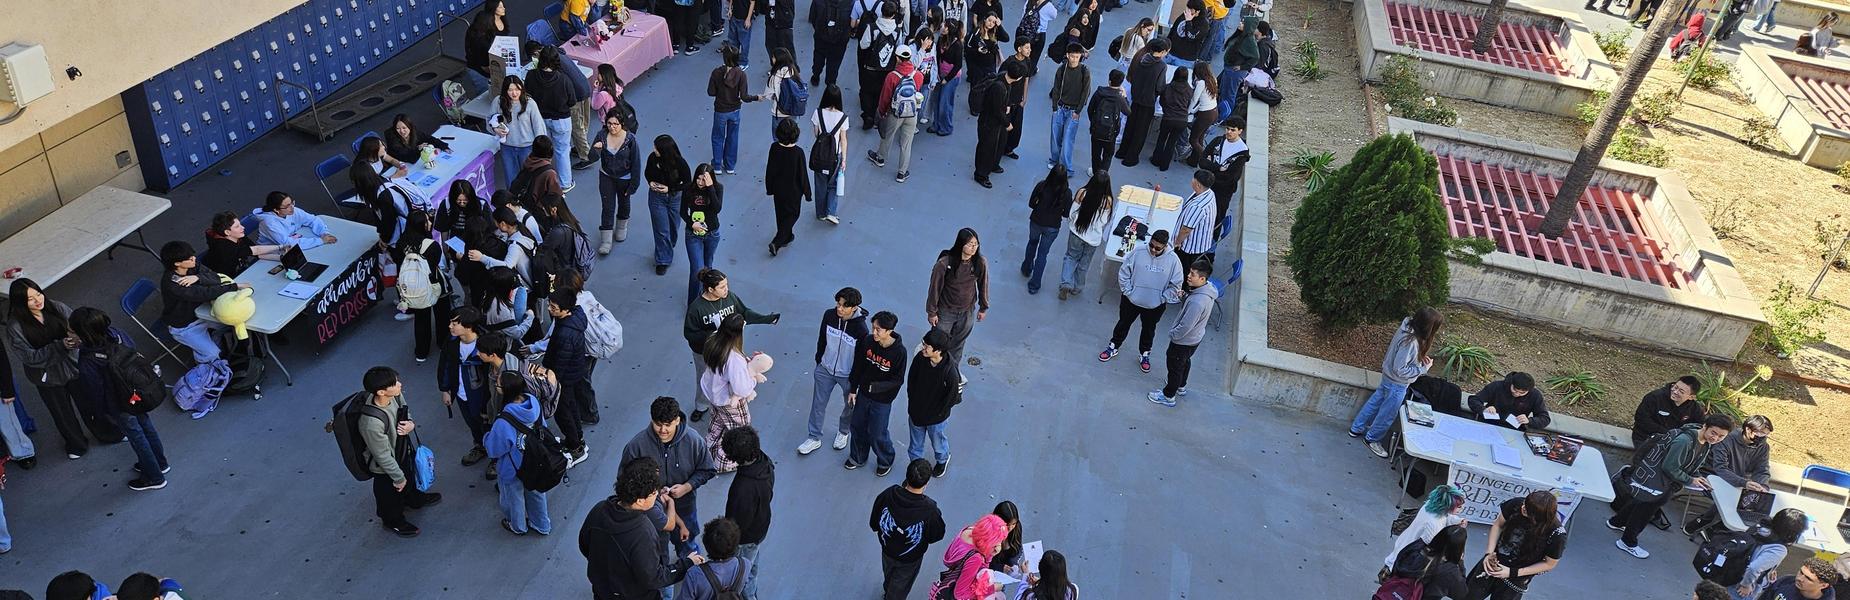
Annual Club Fair
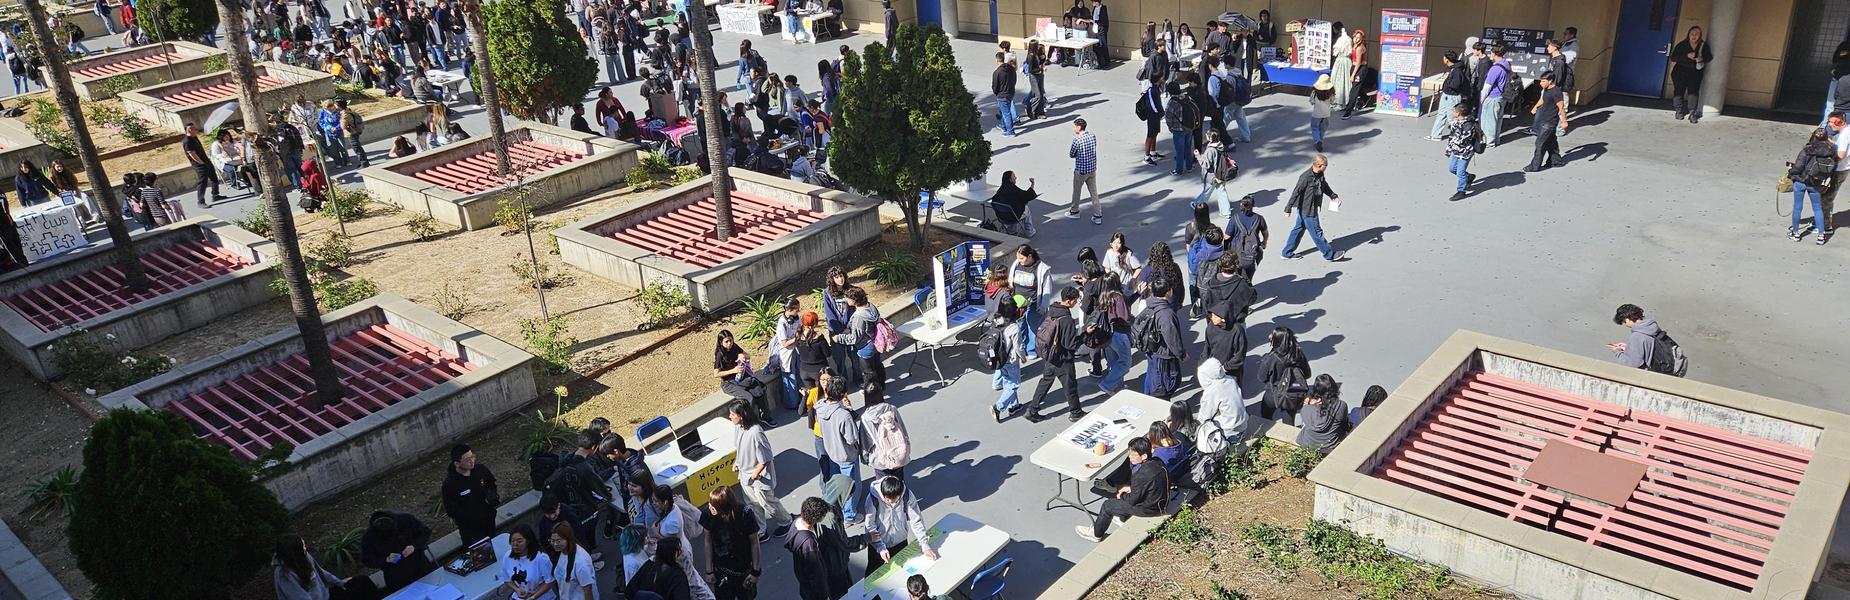
Annual Club Fair
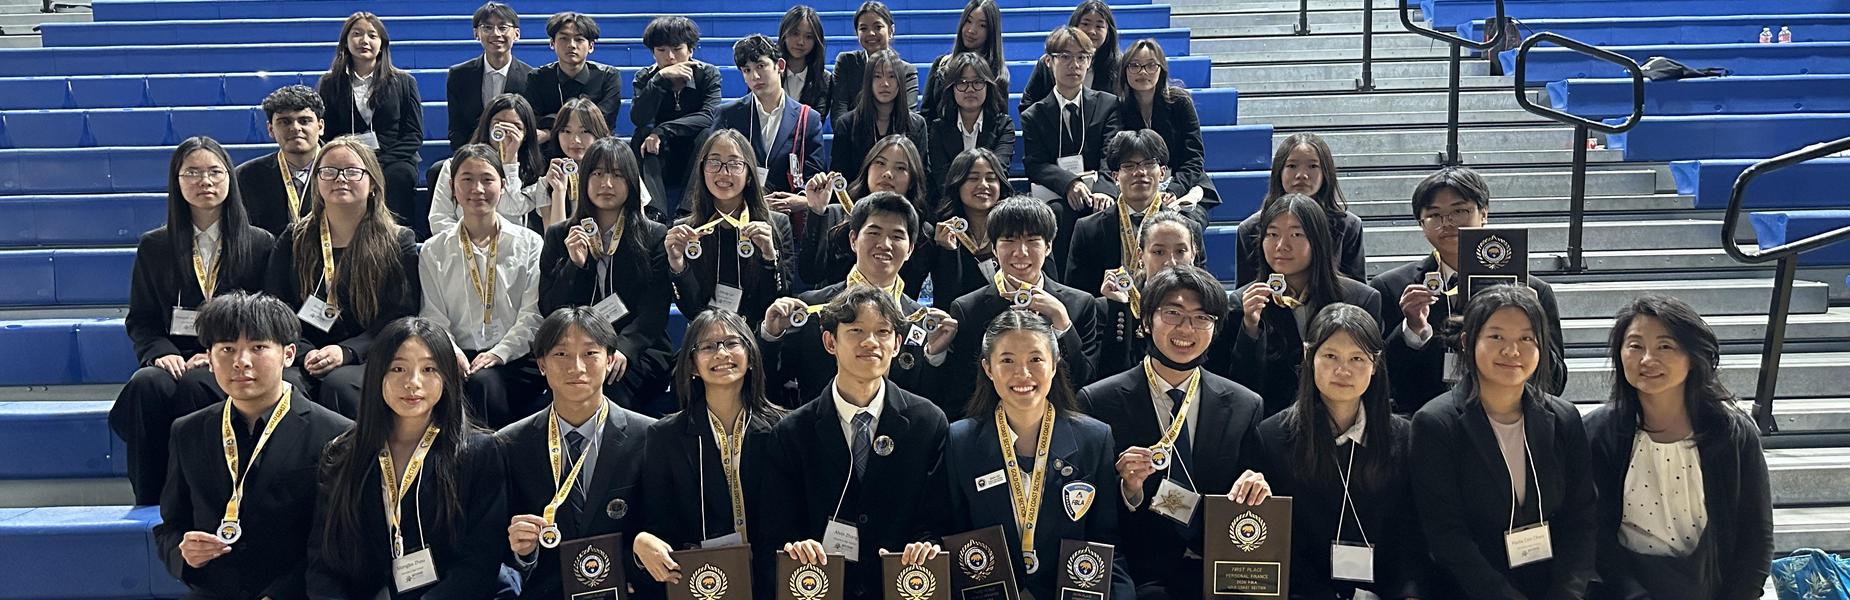
FBLA at Secionals!
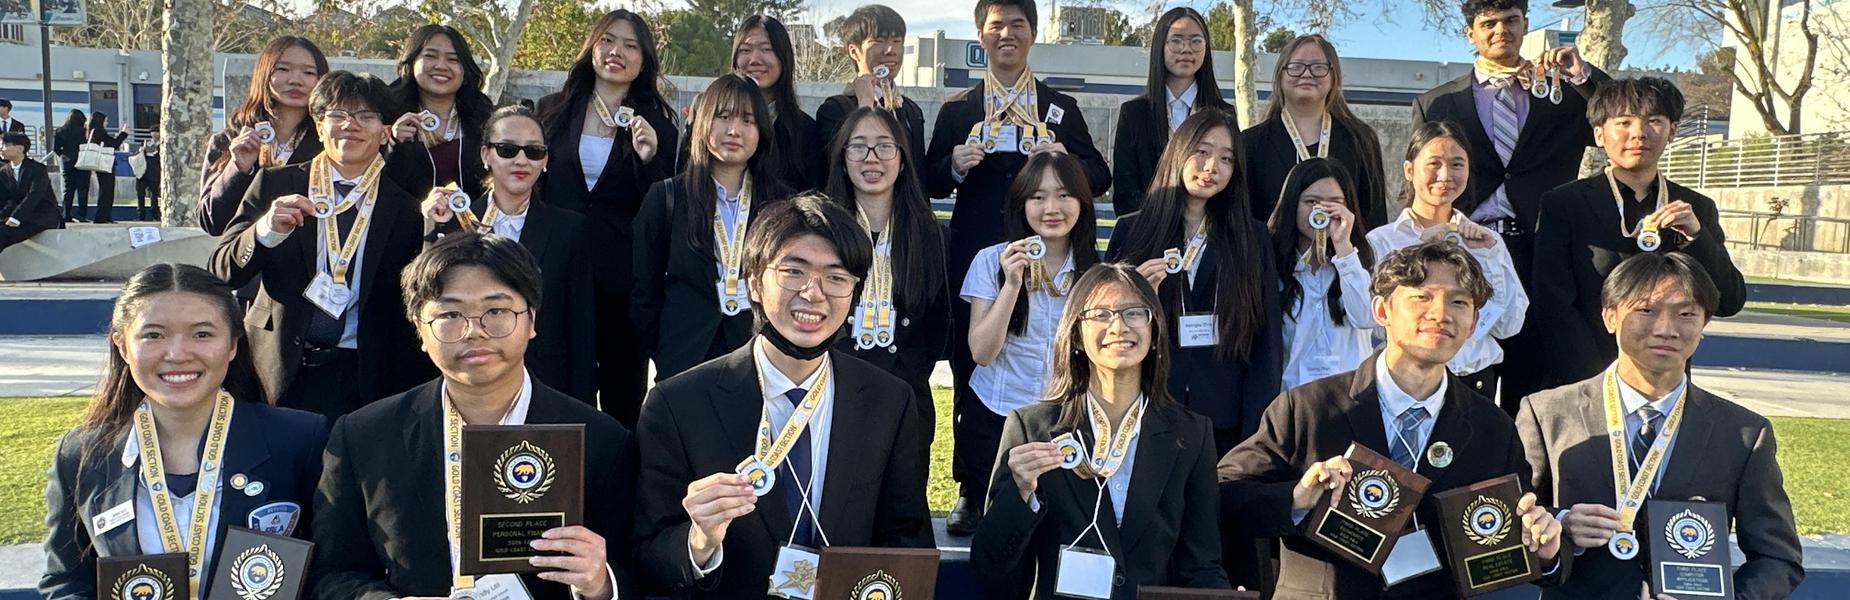
FBLA at Secionals!
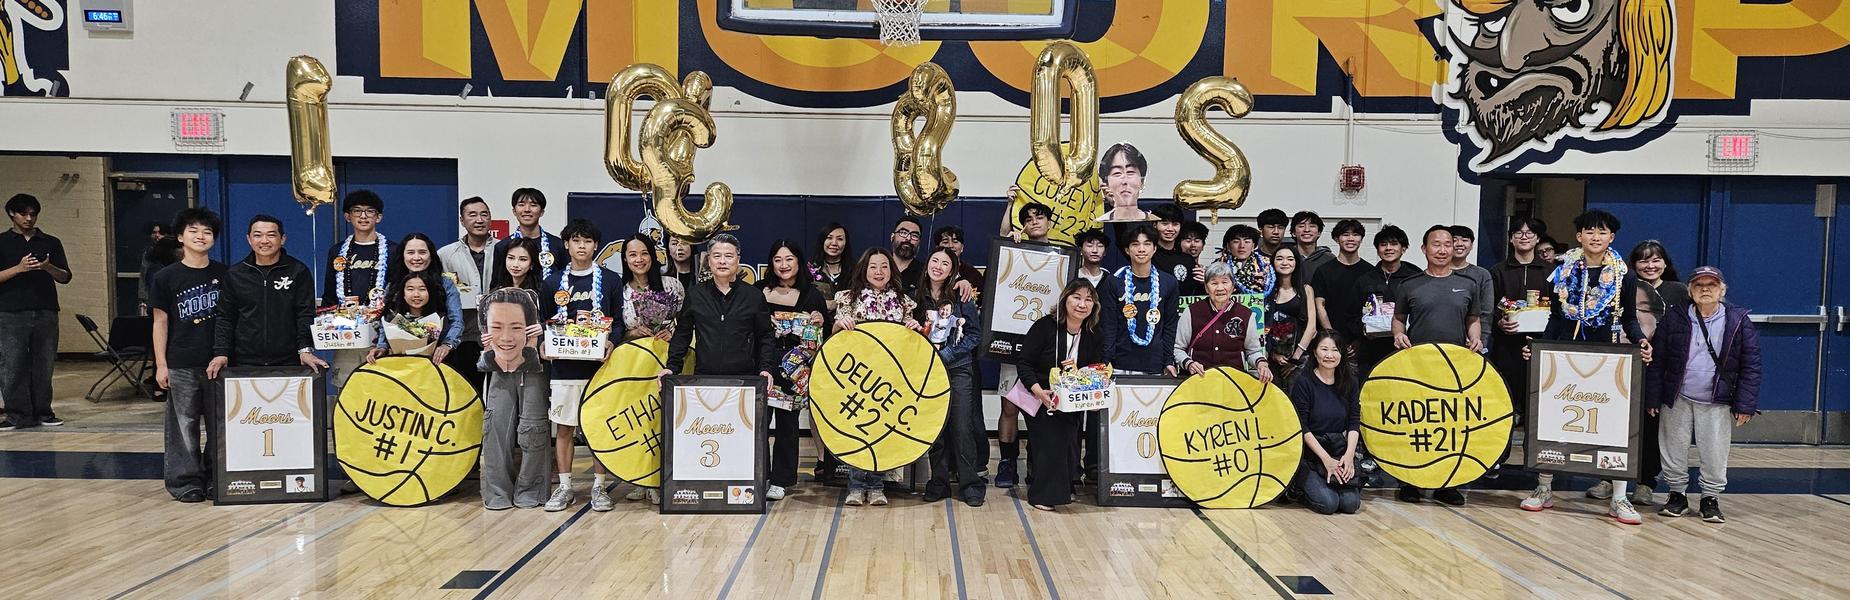
Boys Basketball Senior Night
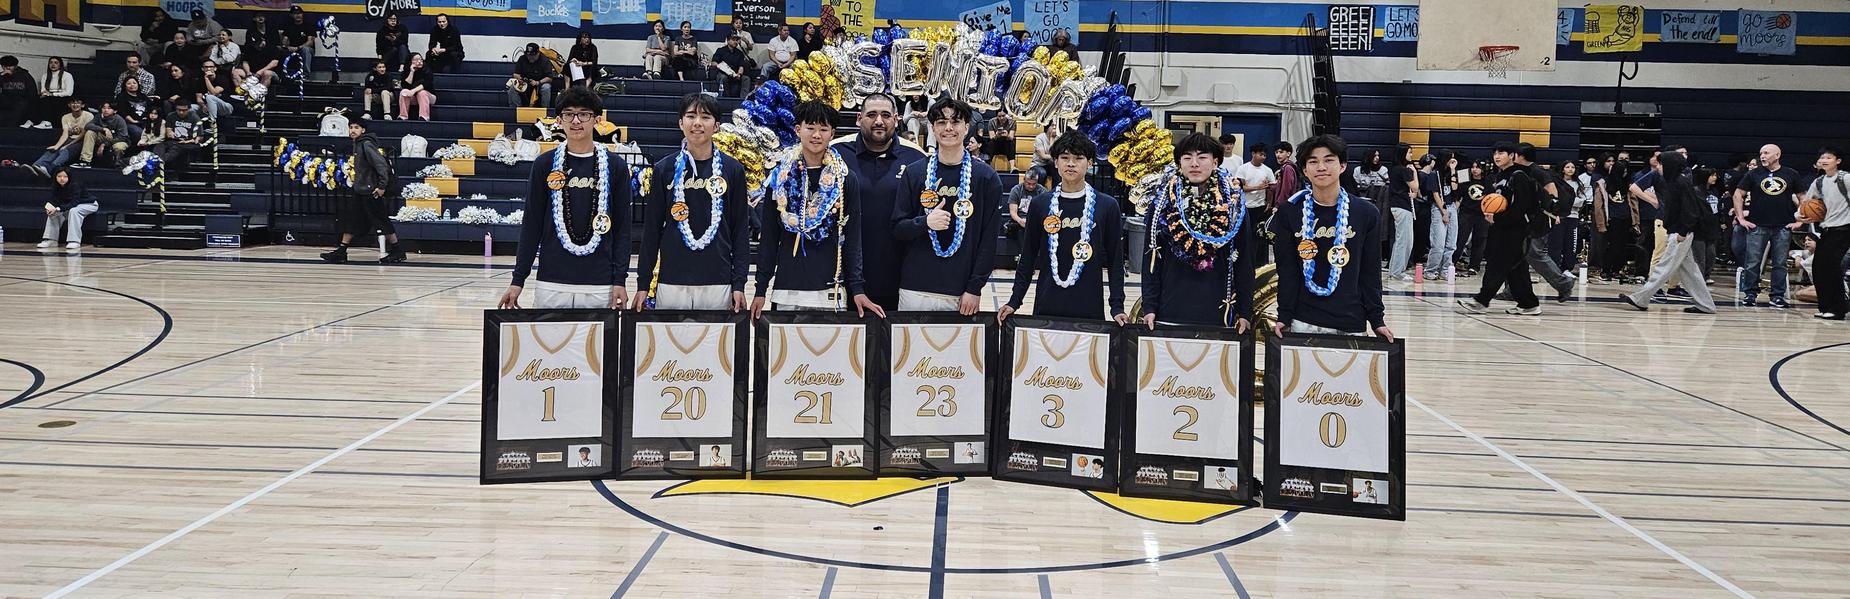
Boys Basketball Senior Night
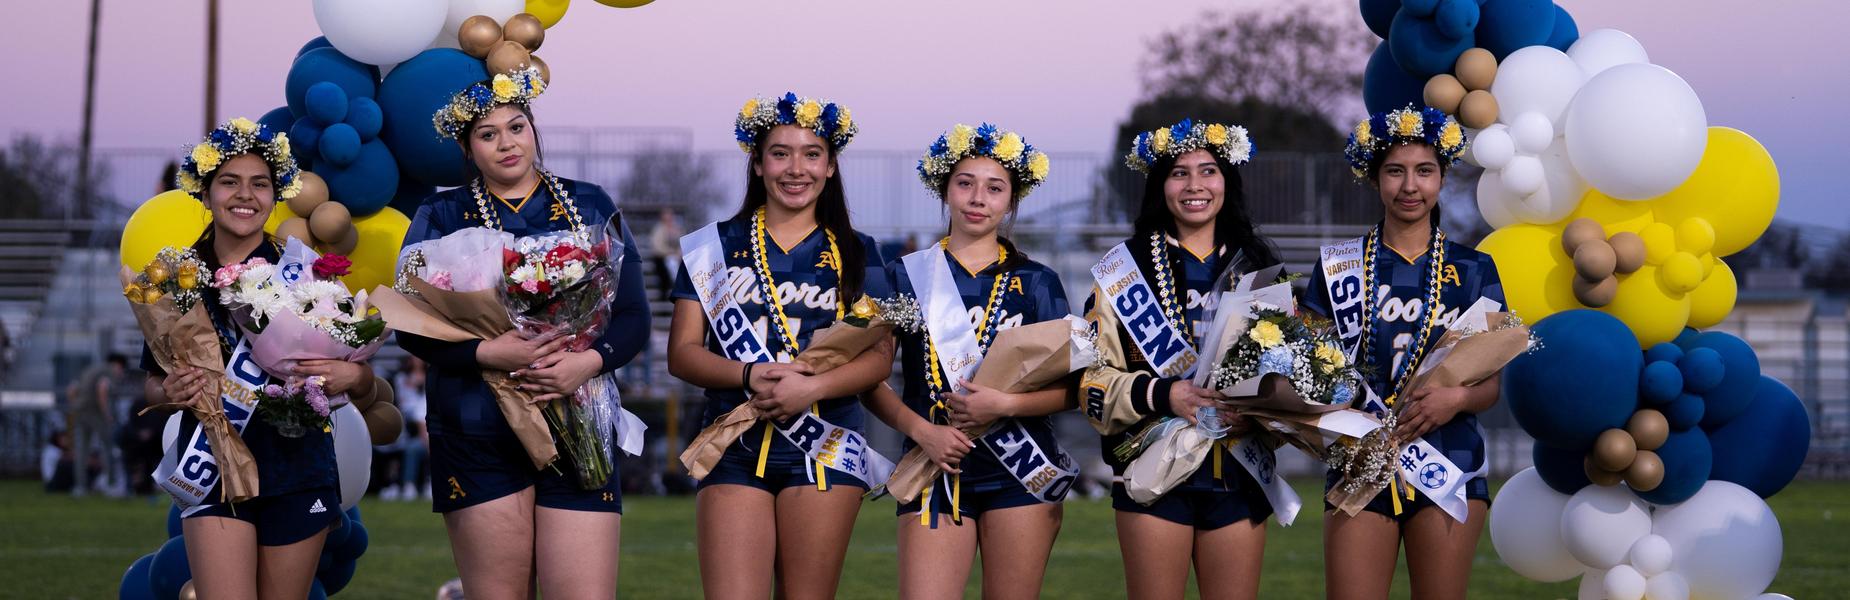
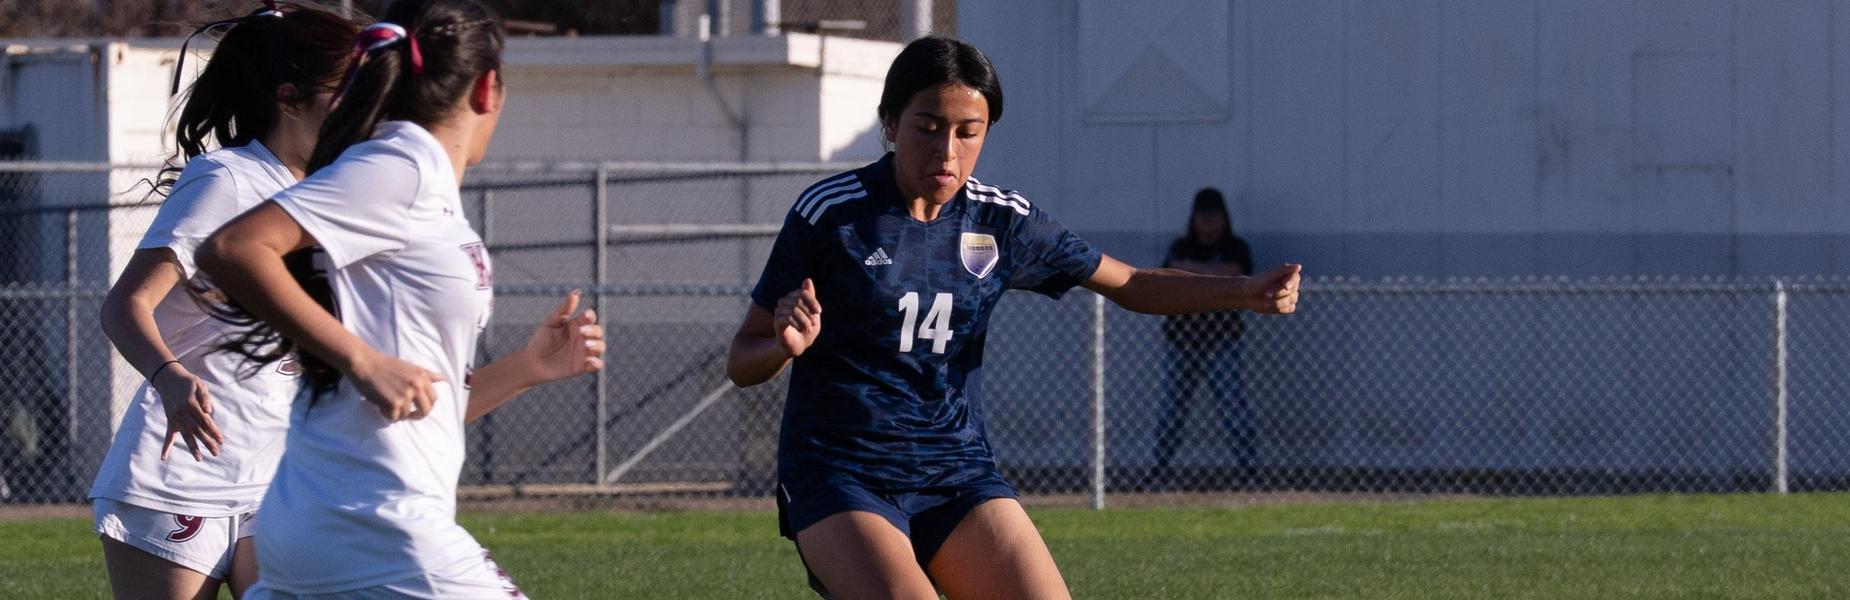
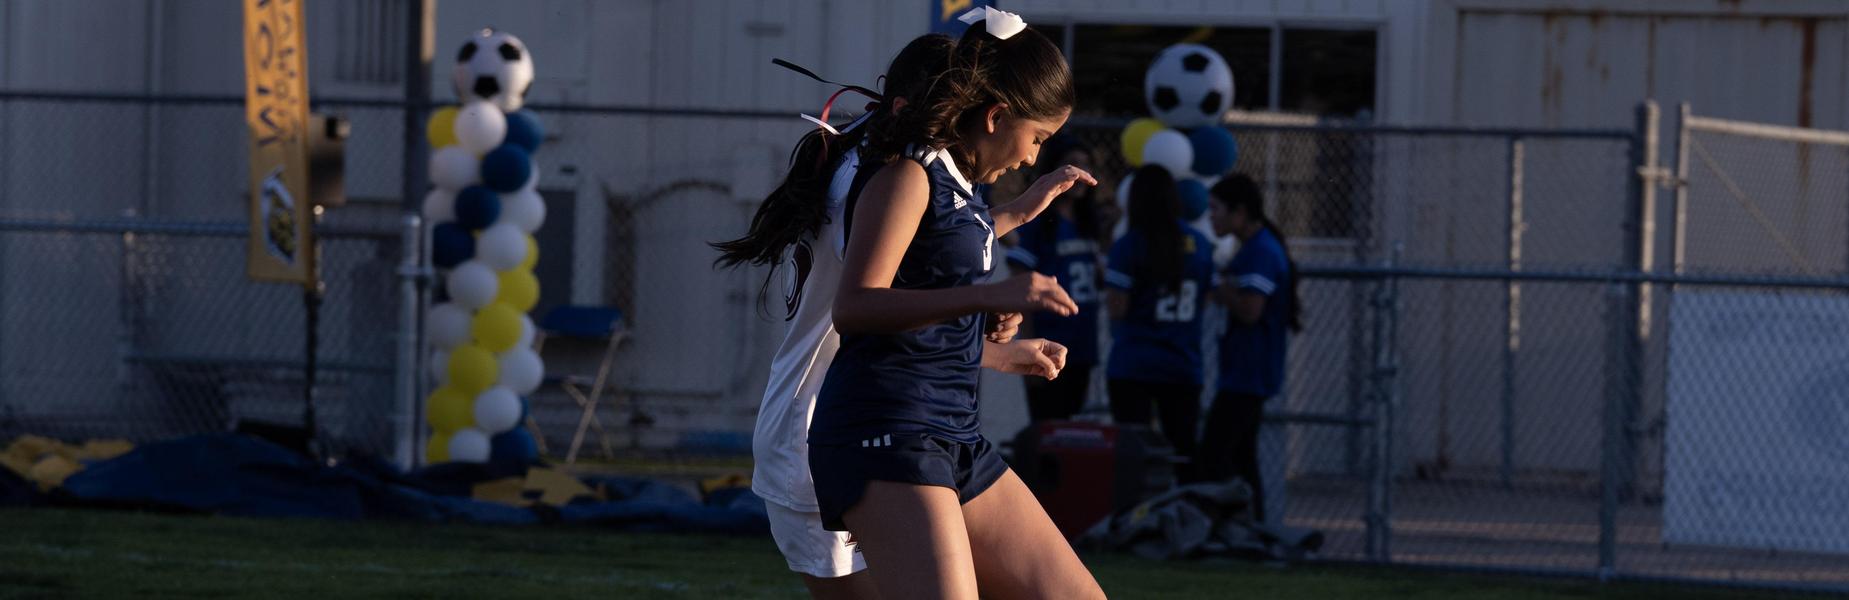
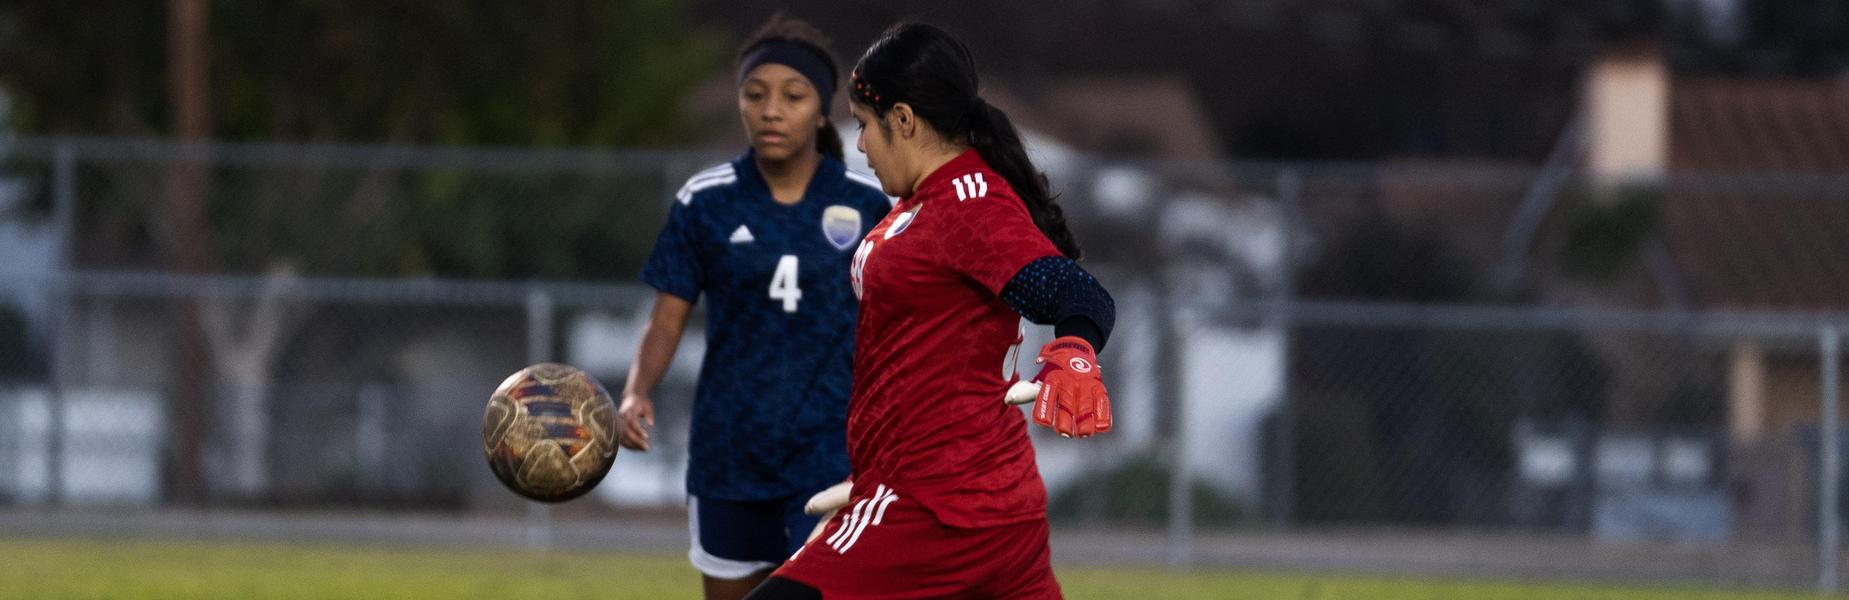
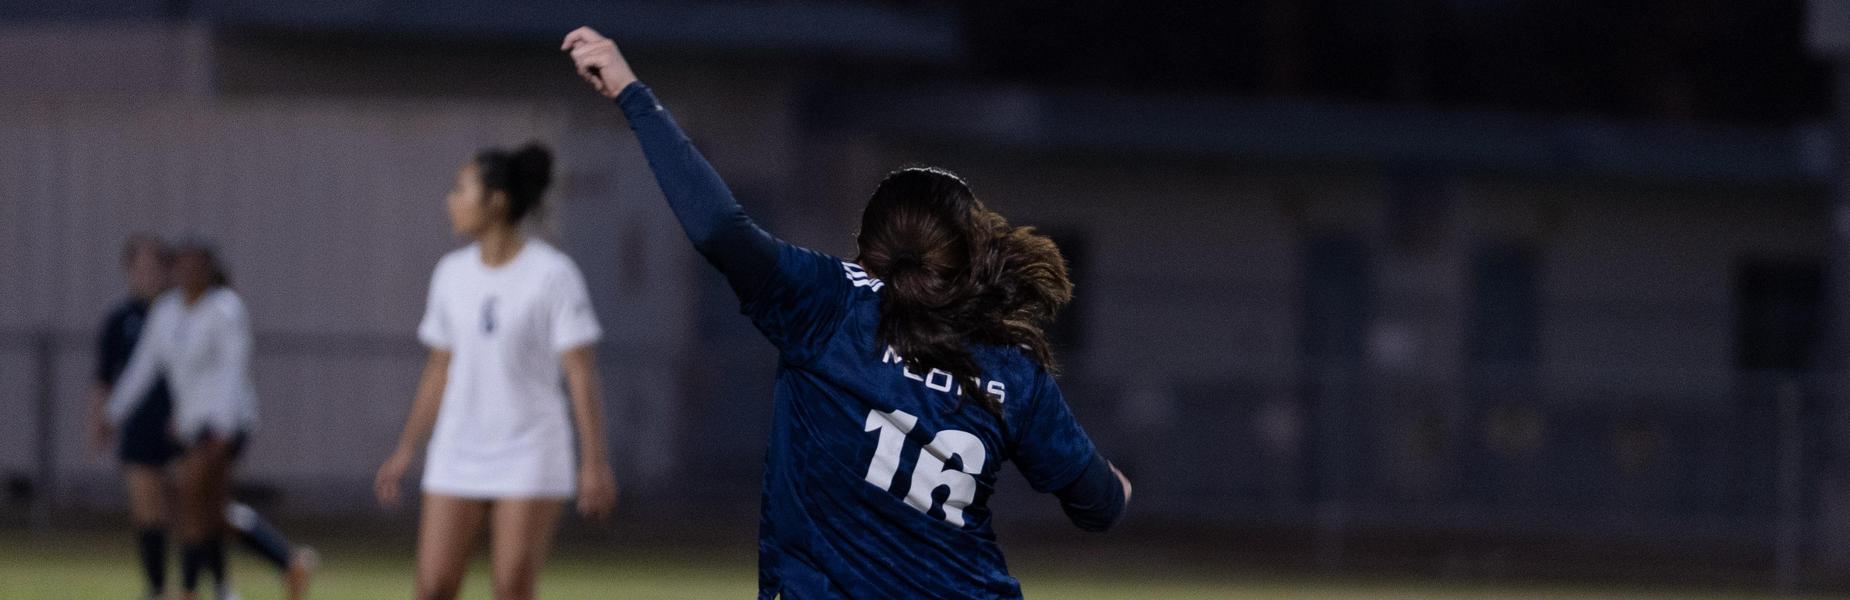
Girls Soccer Senior Night (photo courtesy of Jacob Rojas)
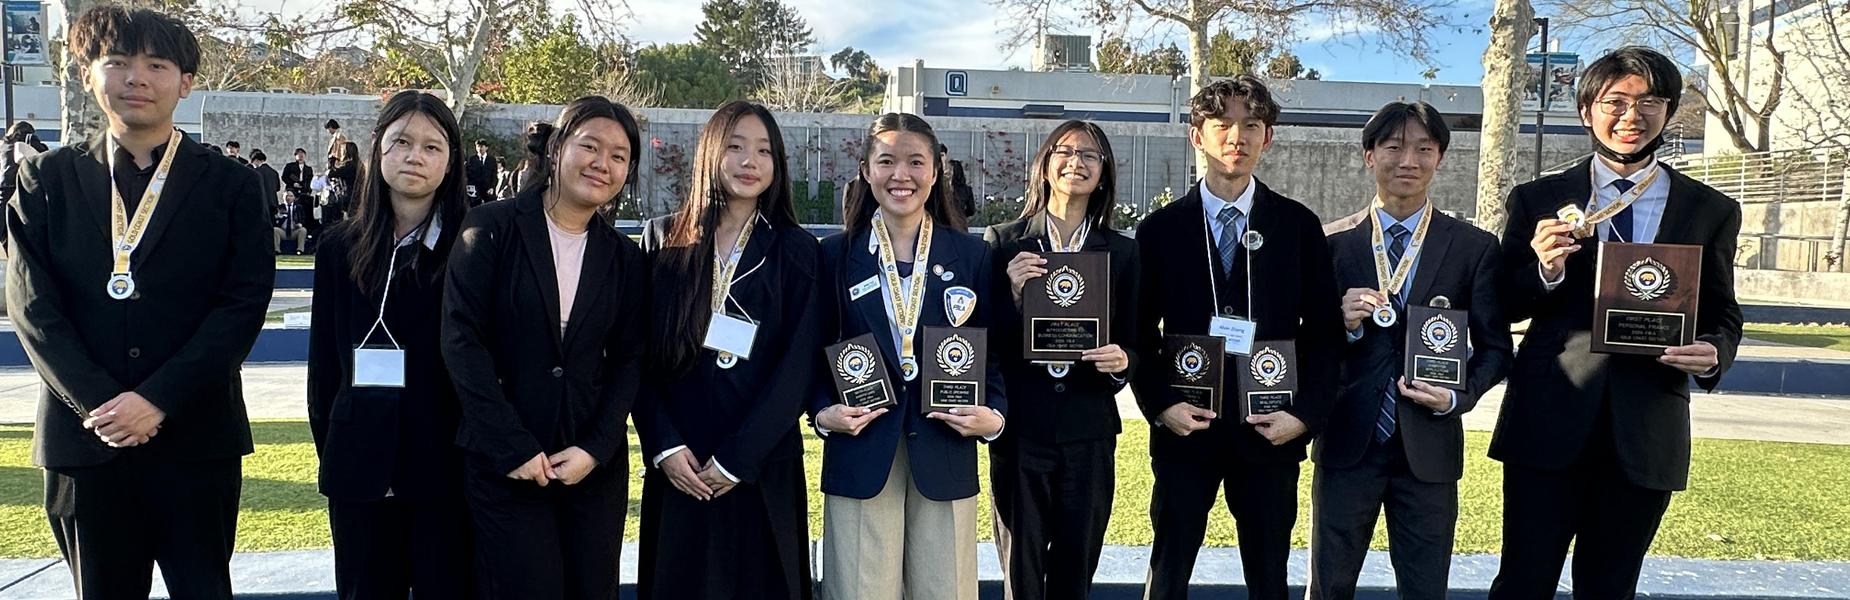
FBLA at Secionals!
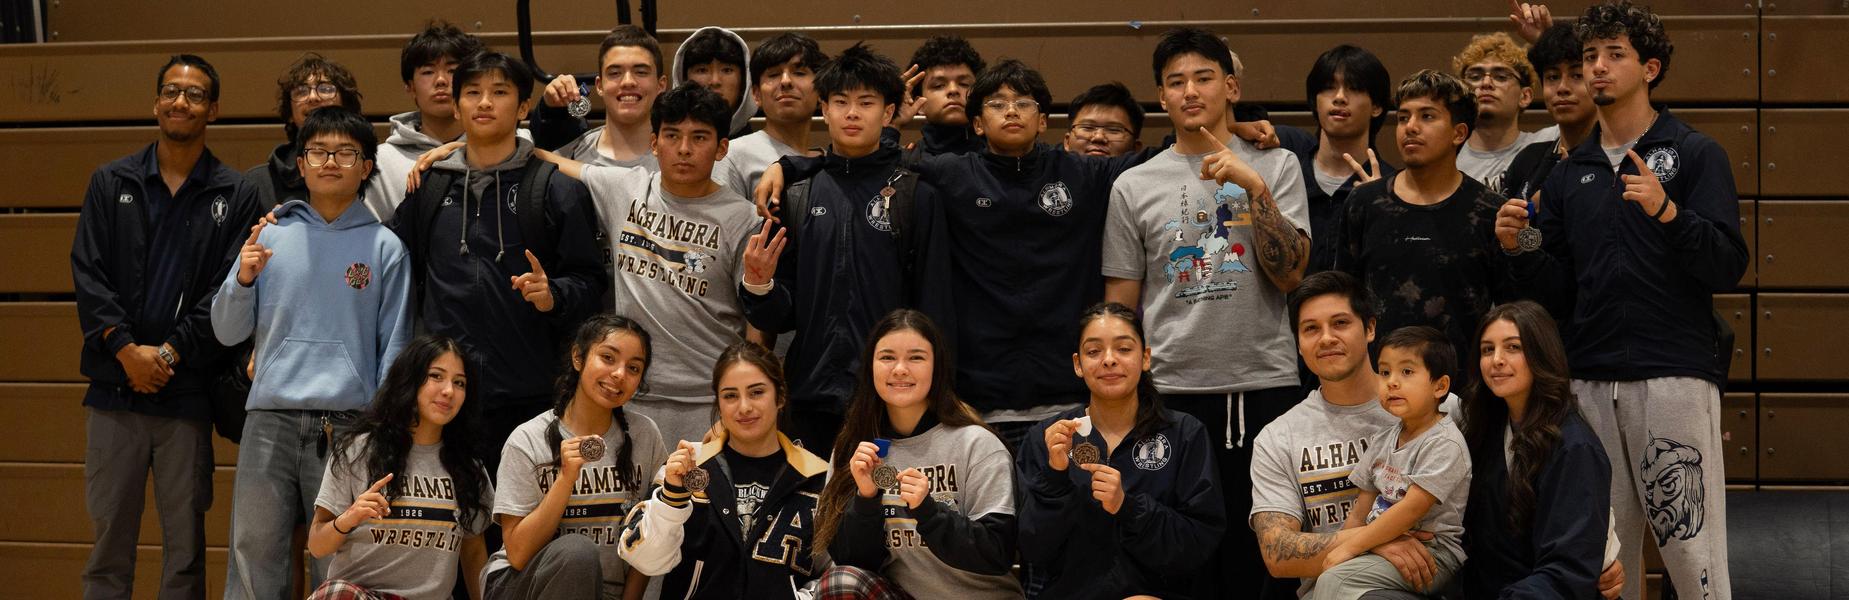
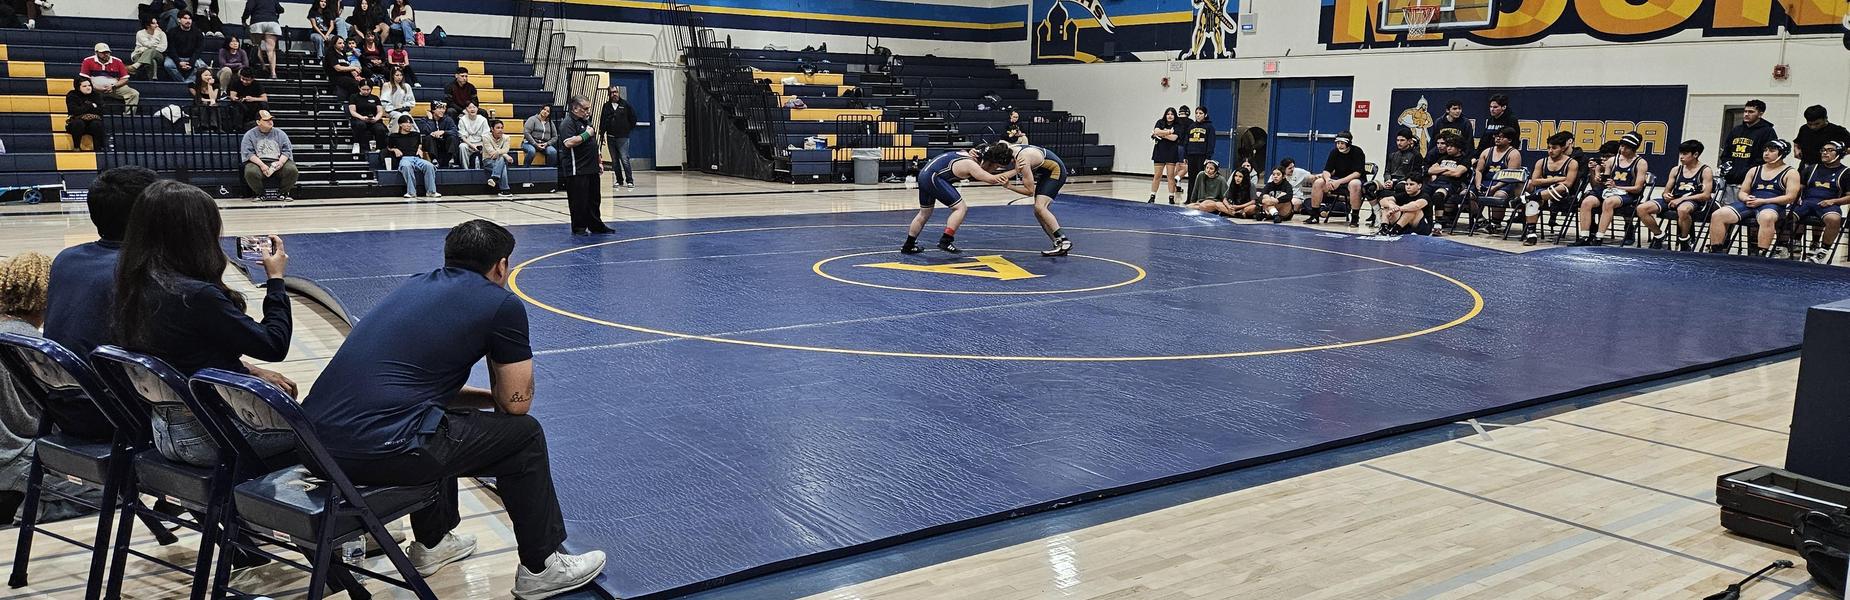
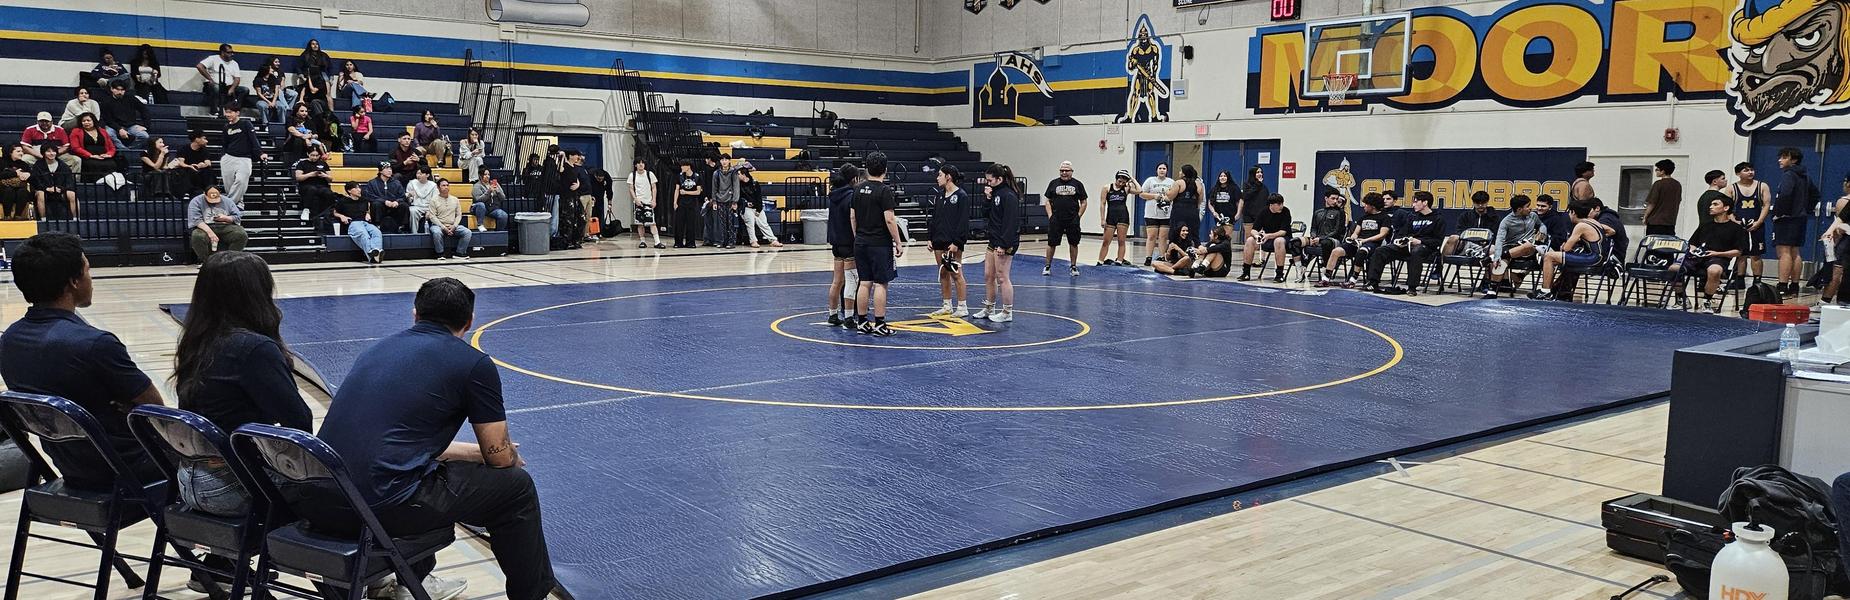
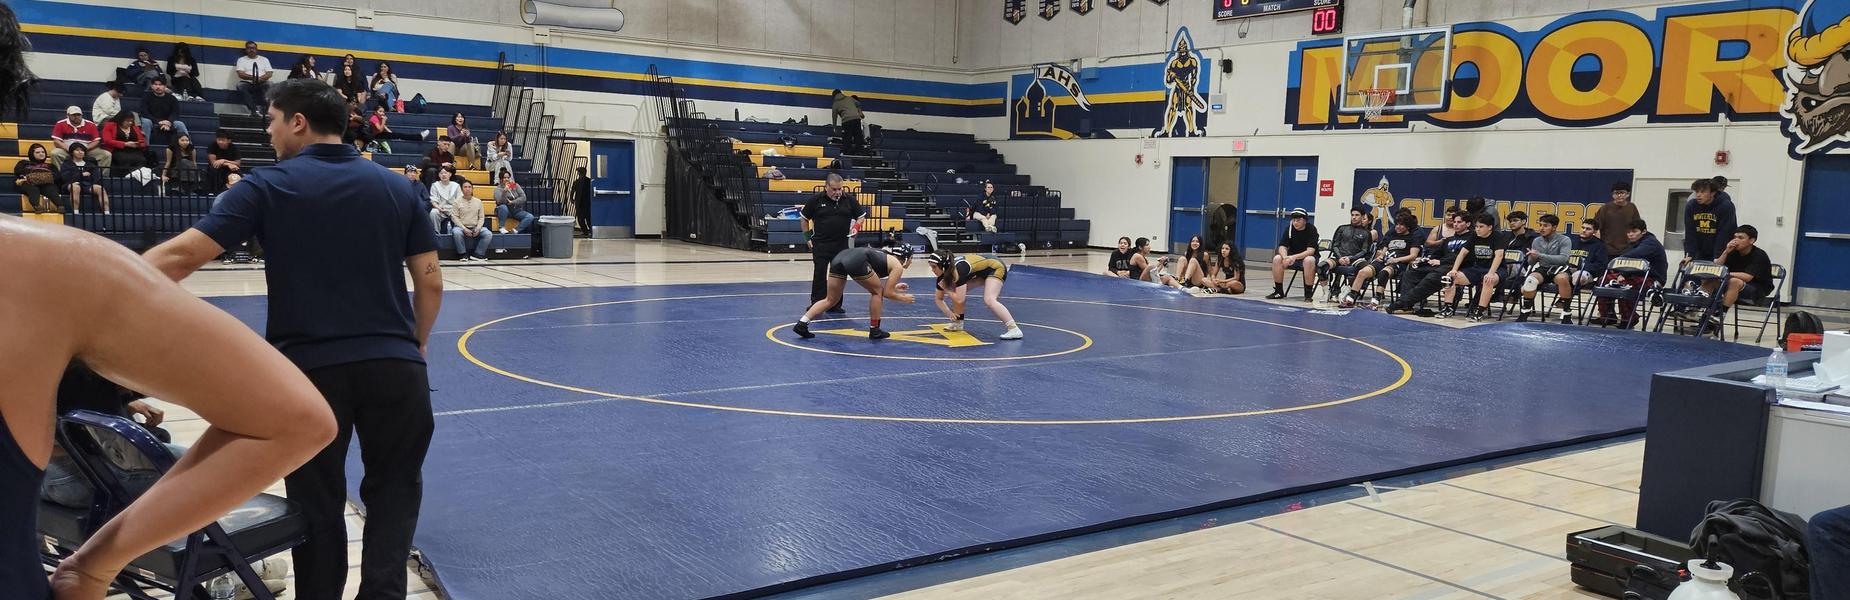
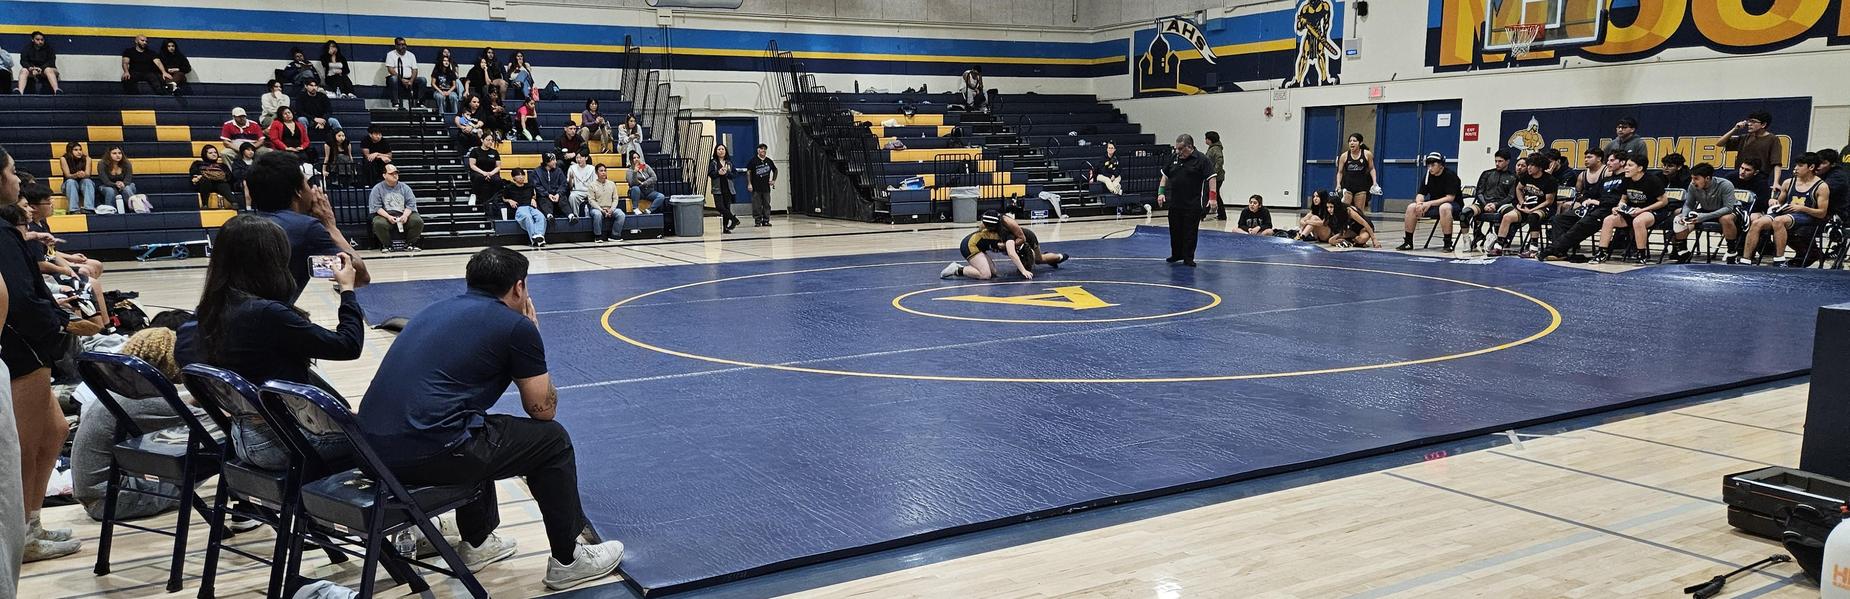
AHS Wrestling Team at League Finals
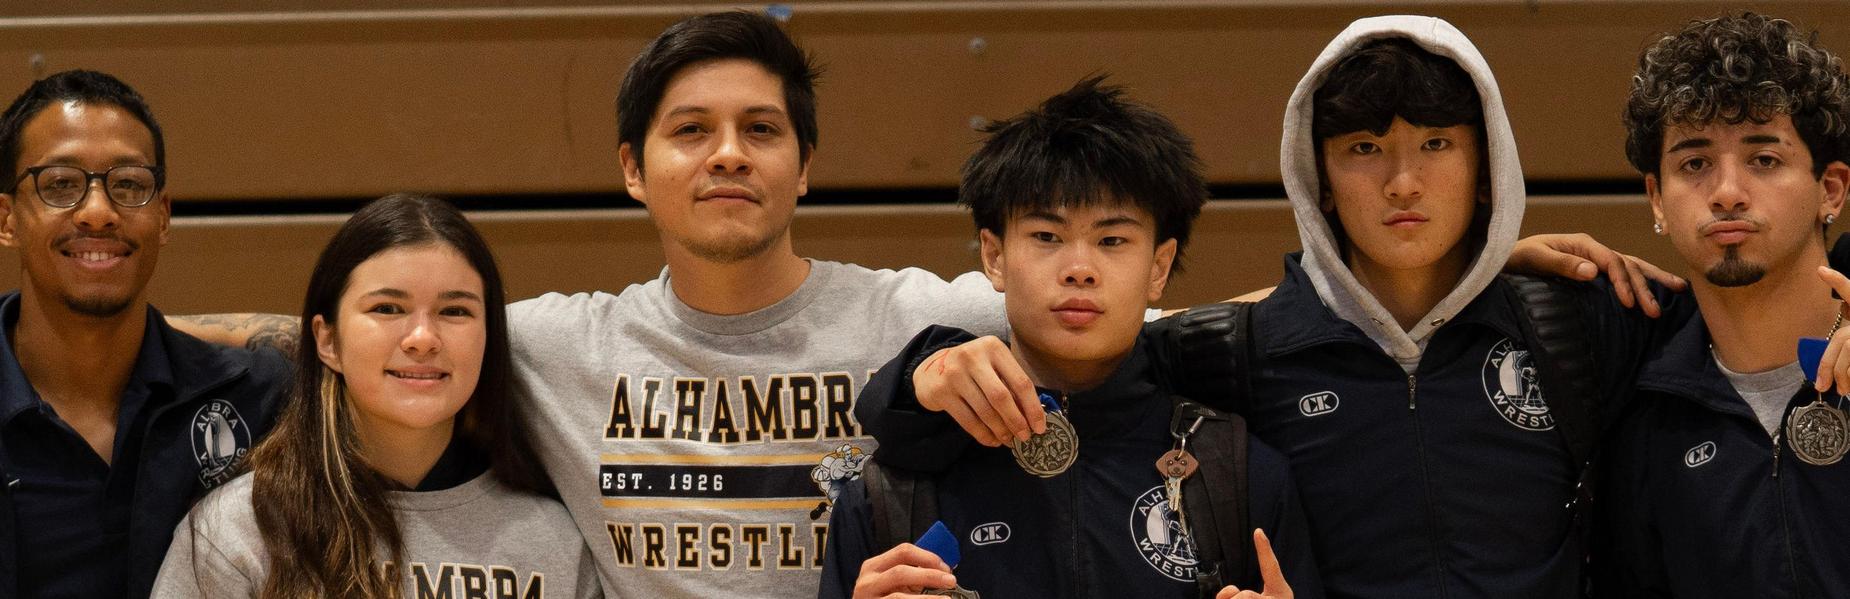
Congrats to the AHS Wrestling Team Almont League First Placers: (from l-r) Coach Brian, Reagan Kelly, Coach Logan, Vincent Tran, Tasuke Takahashi & Aiden Nava.
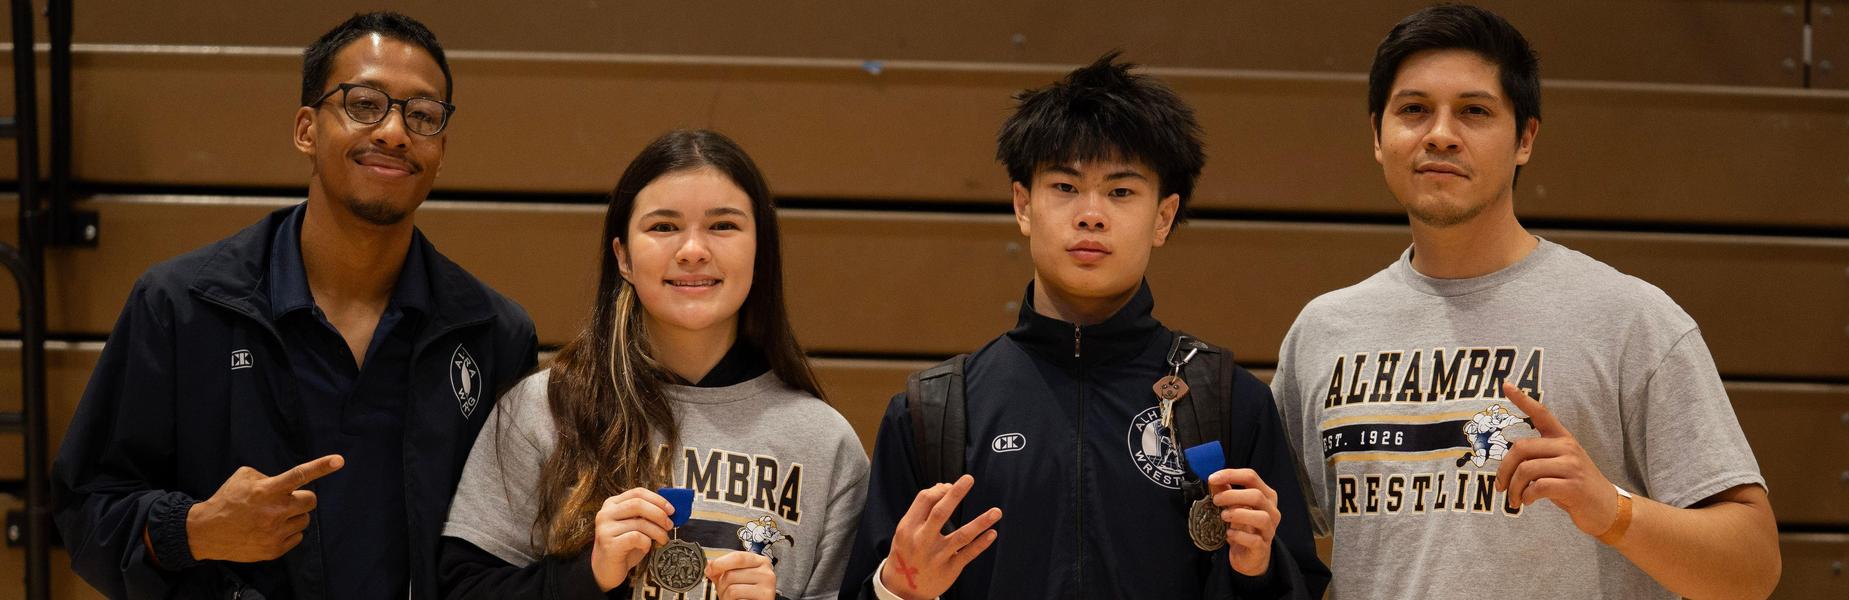
Congrats to the AHS Wrestling Team Light-Weight Almont League MVPs: Reagan Kelly and Vincent Tran!
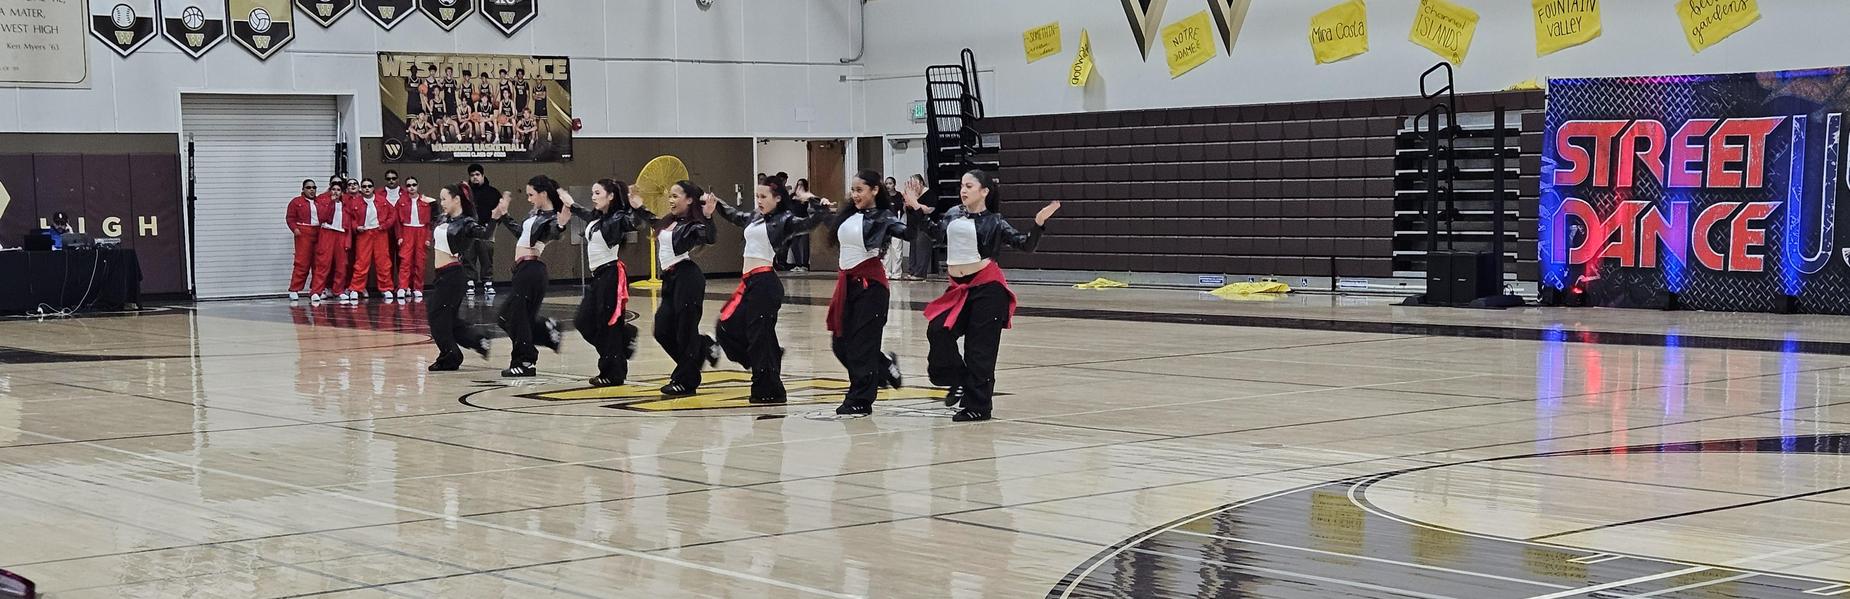
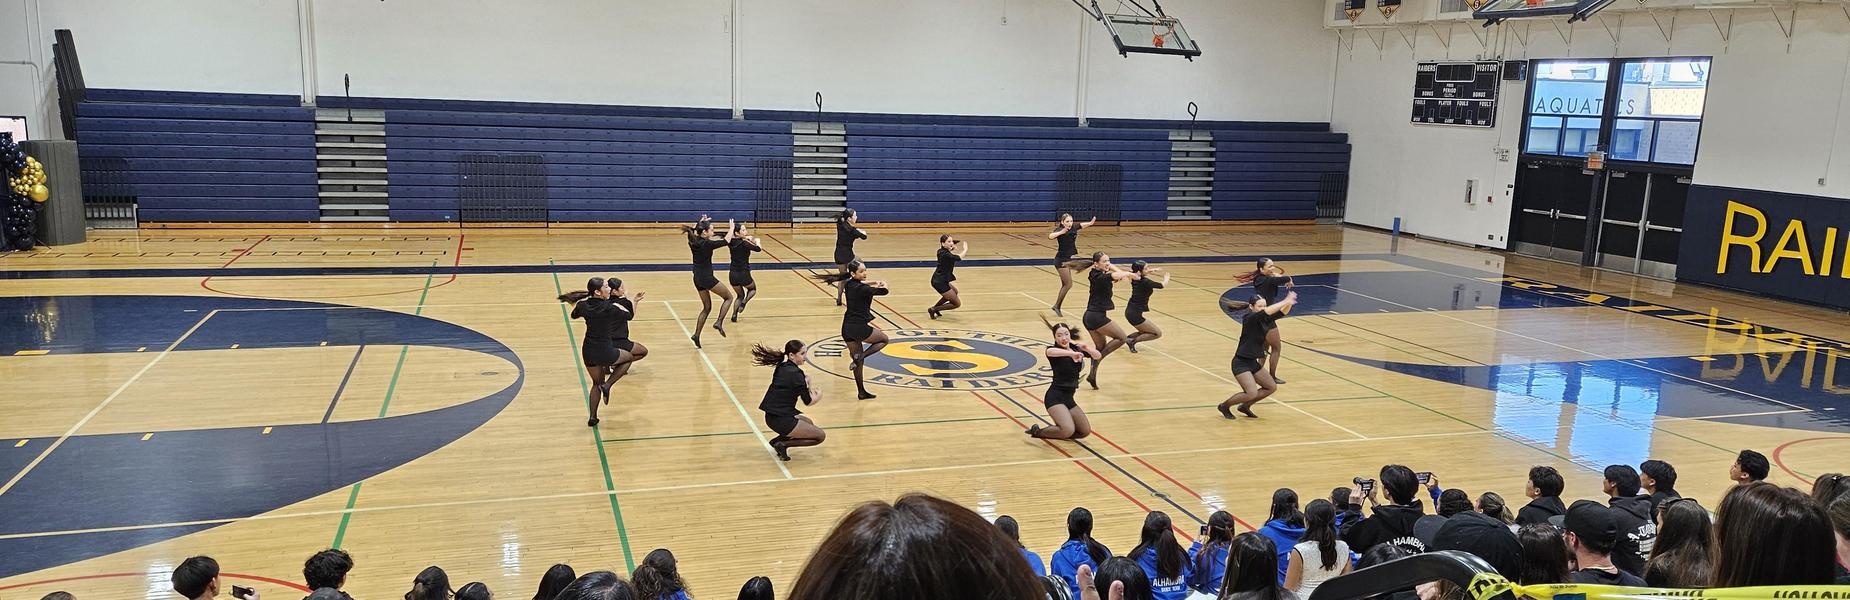
Small All Female at Street Dance
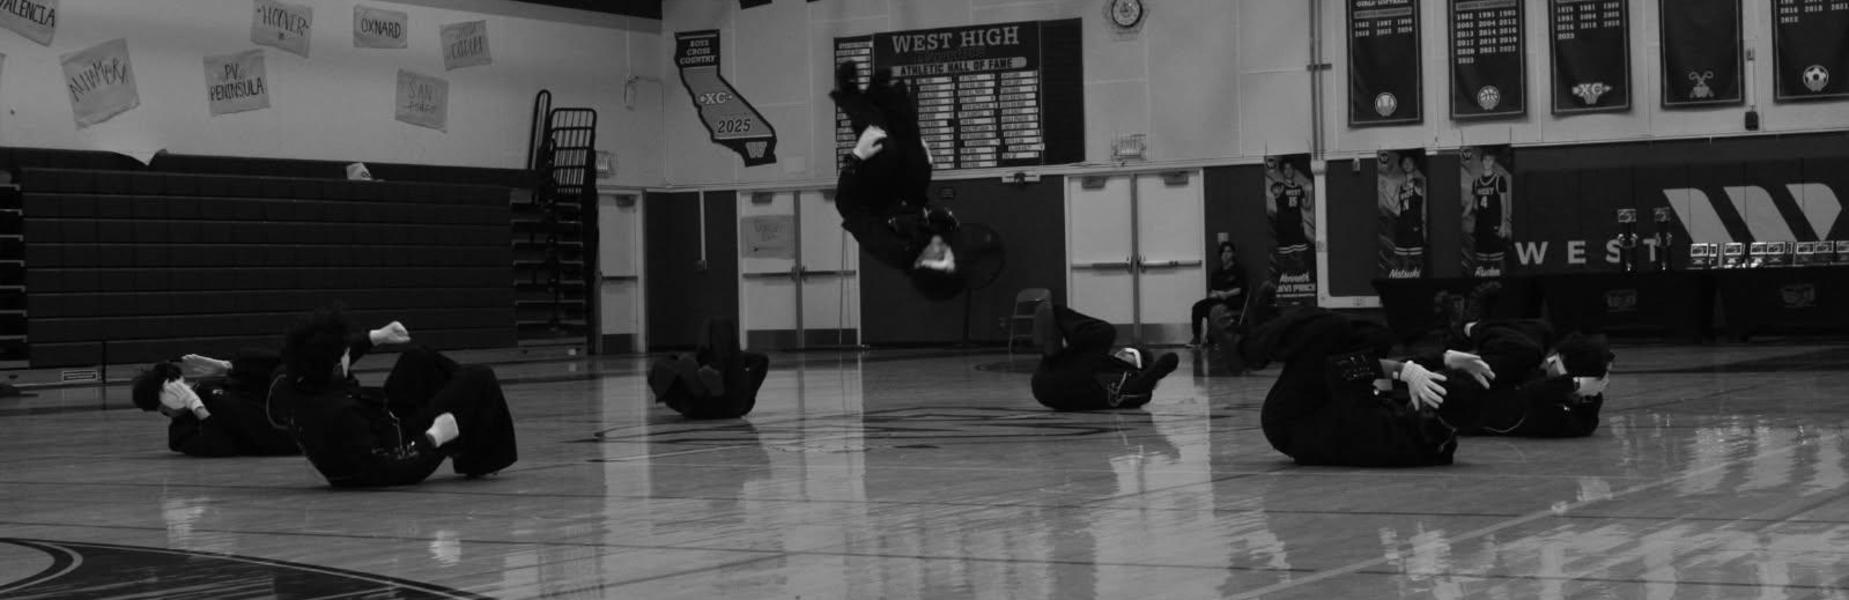
Small All Male
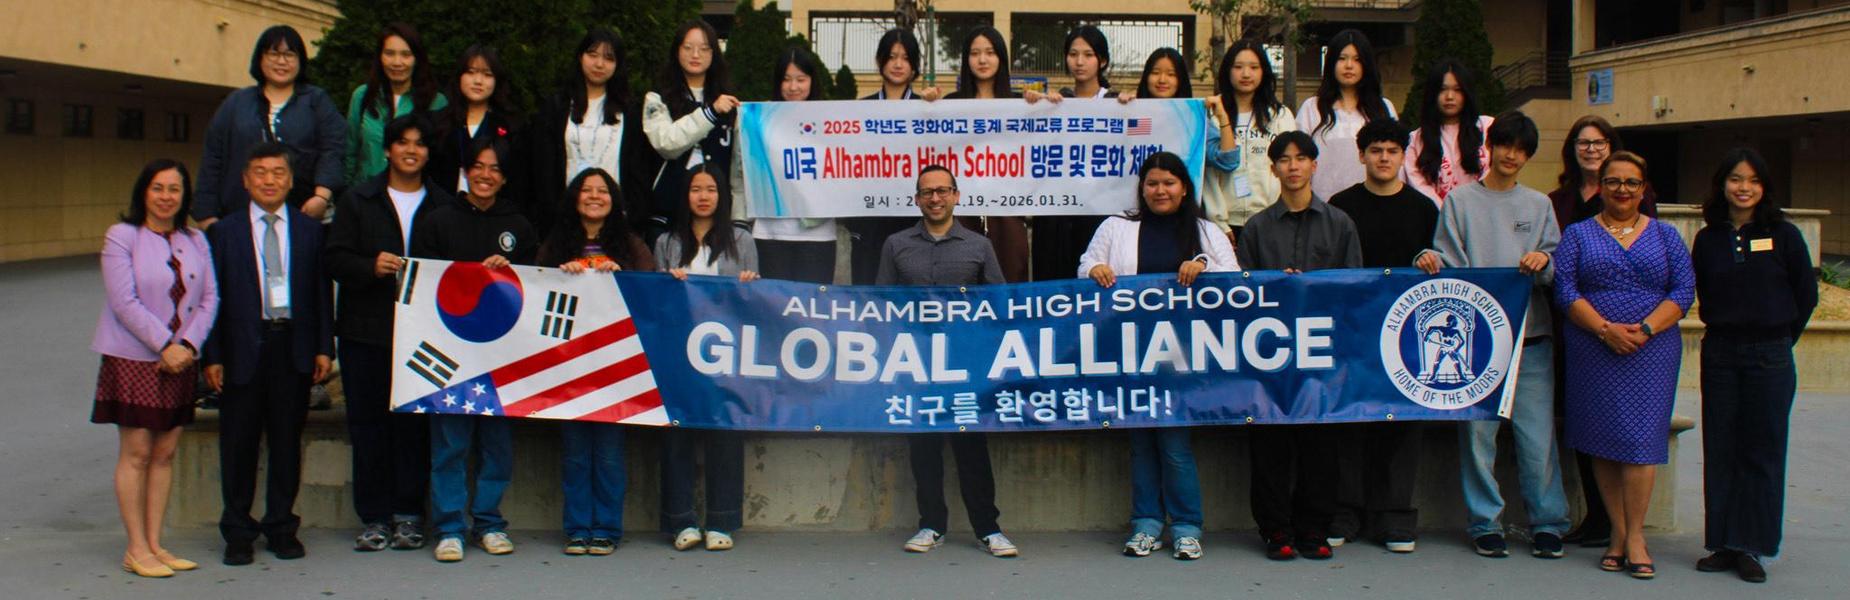
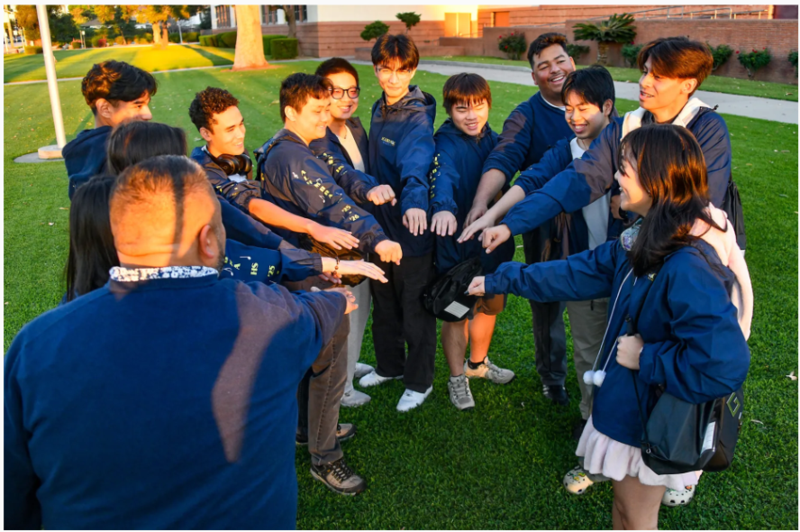
Korean Student Exchange Program (photo courtesy of Emmett Lee)


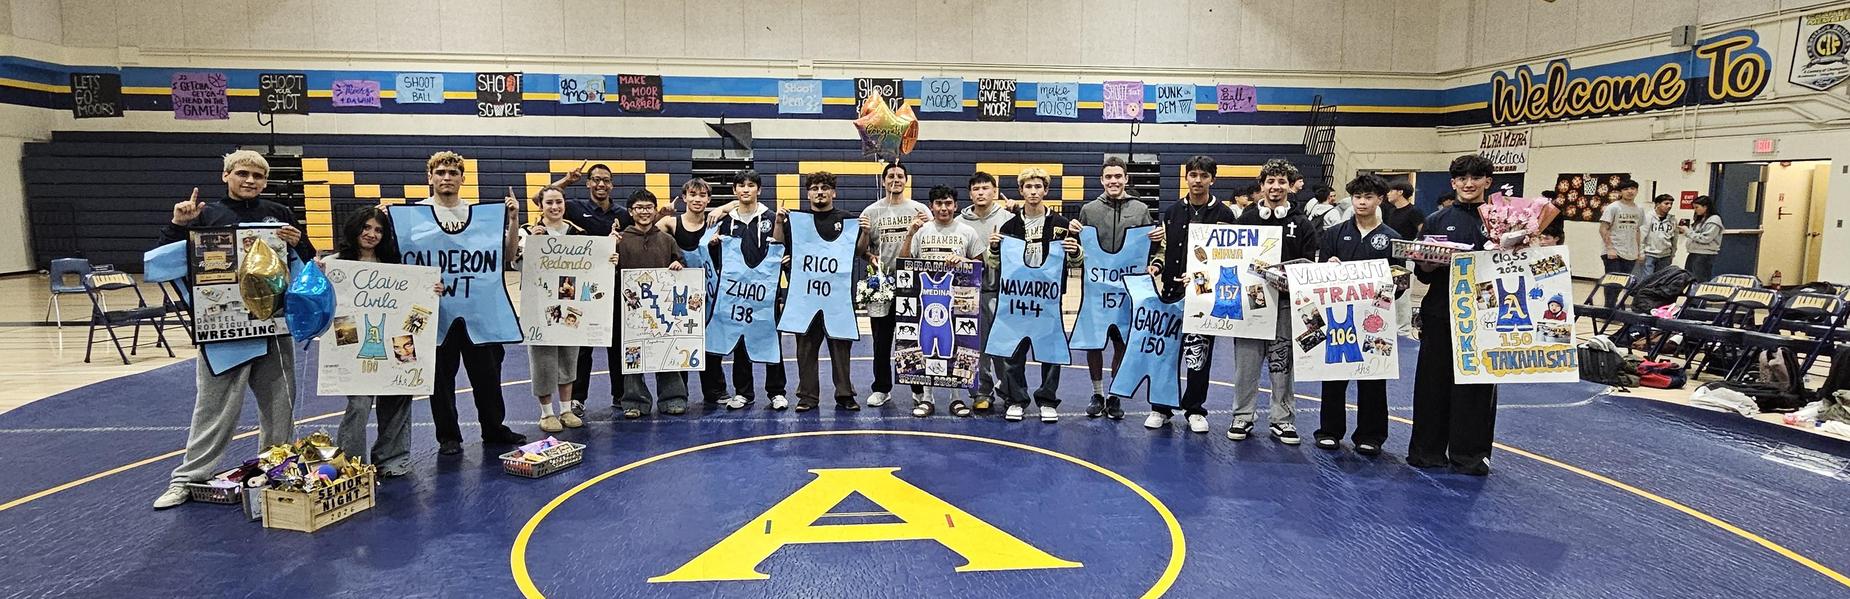
Wrestling Team Senior Night
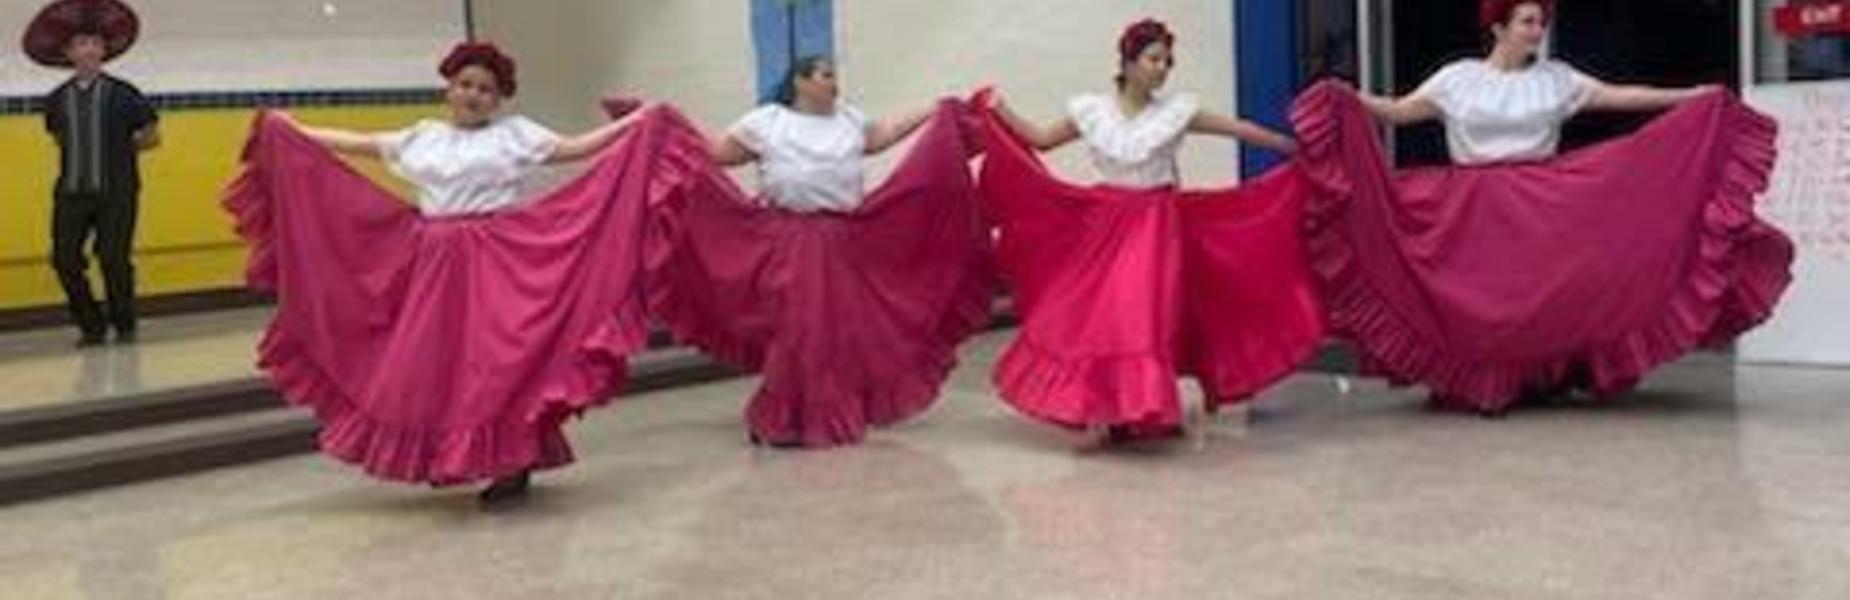
Folklorico Showcase Night
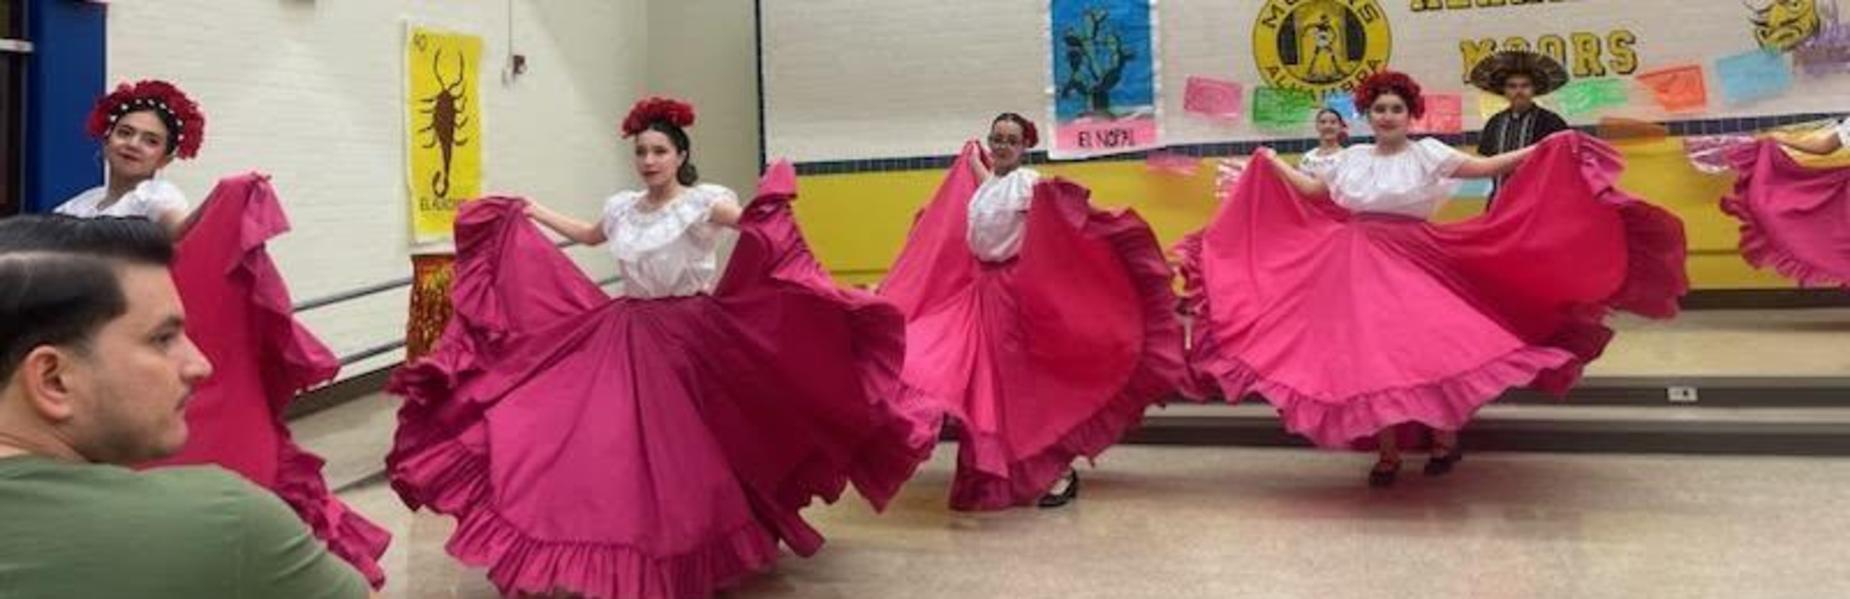
Folklorico Showcase Night
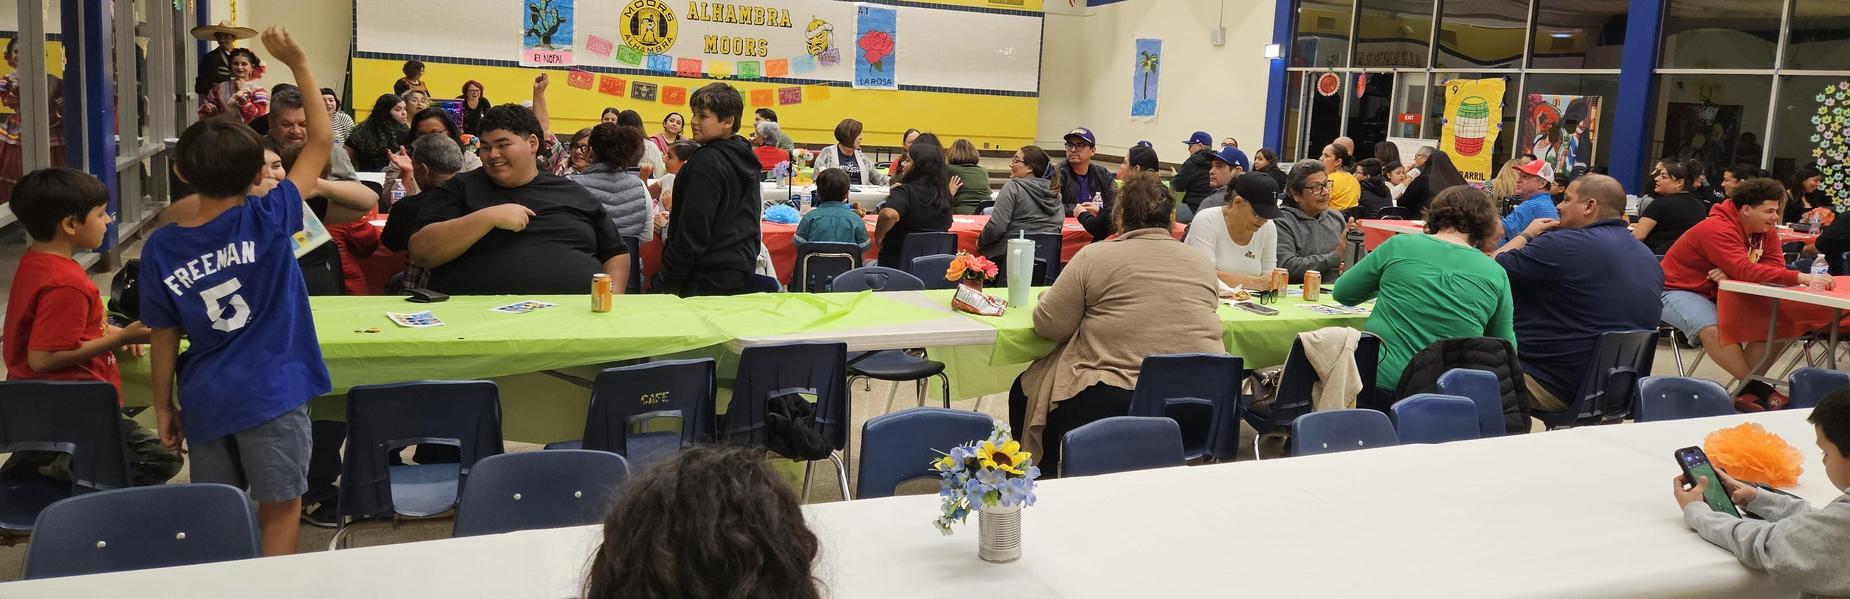
Folklorico Showcase Night
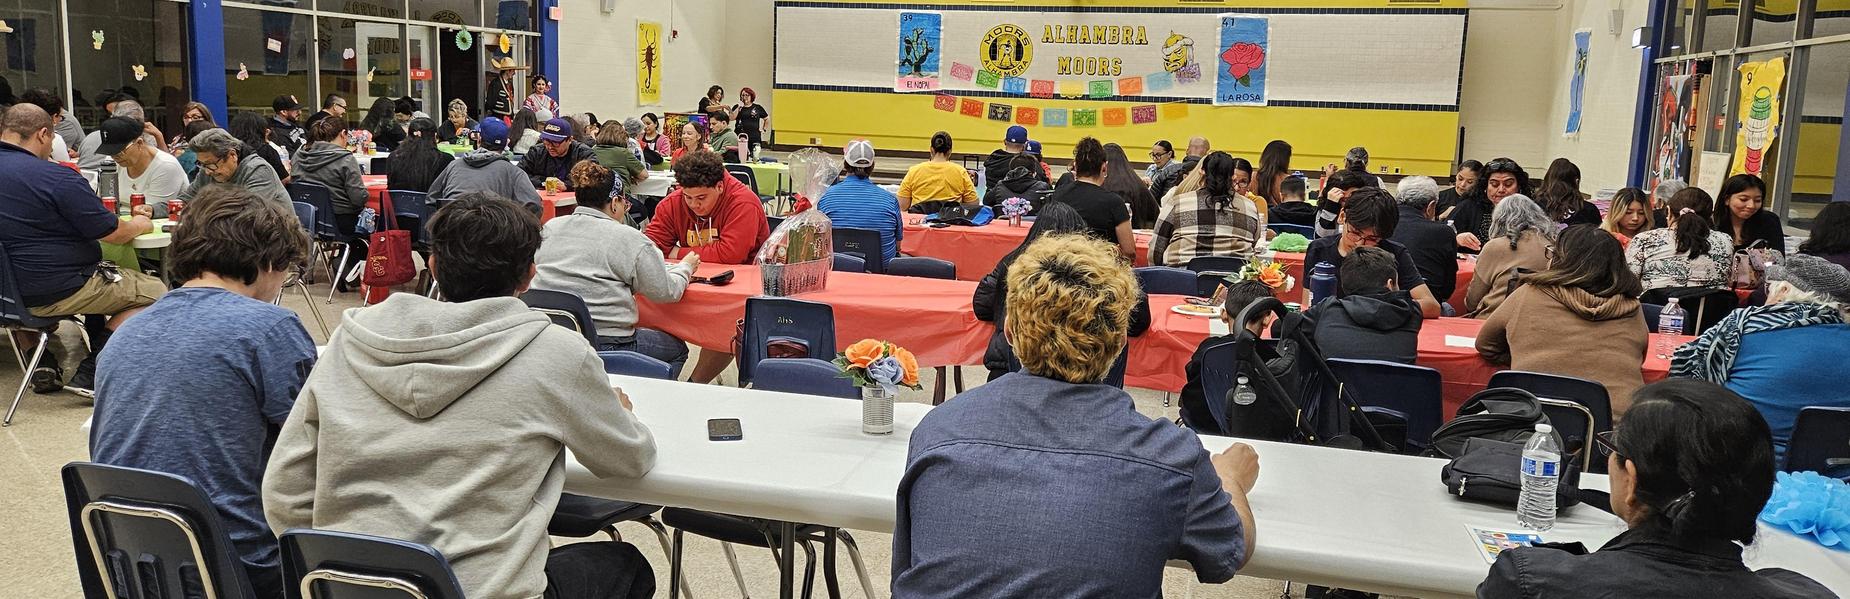
Folklorico Showcase Night
Folklorico Showcase Night
Girls JV Basketball
Girls JV Basketball
Girls JV Basketball
Dance Team & All Male Season Opener at CA Pacific Championships!
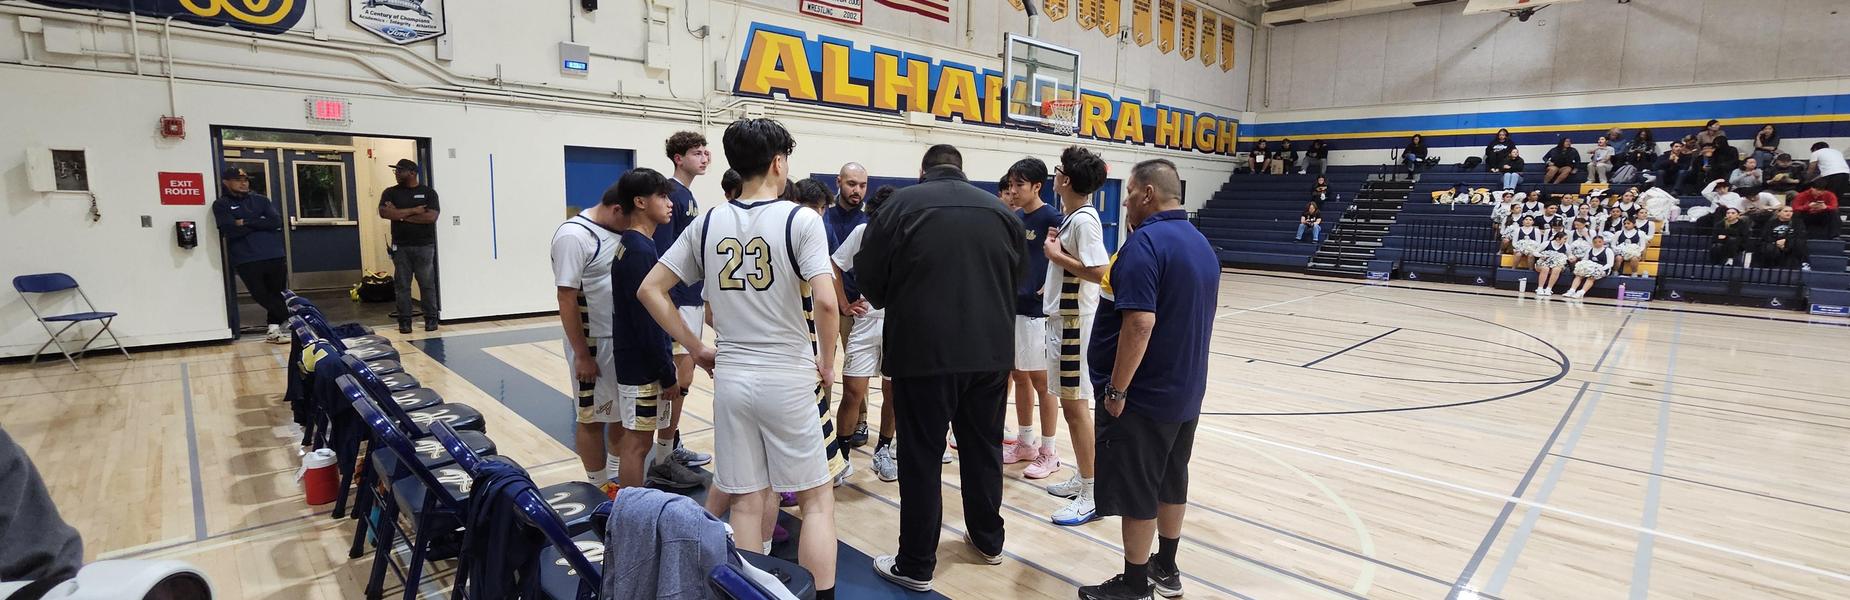
Frosh Soph Boys Basketball
Frosh Soph Boys Basketball

Frosh Soph Boys Basketball
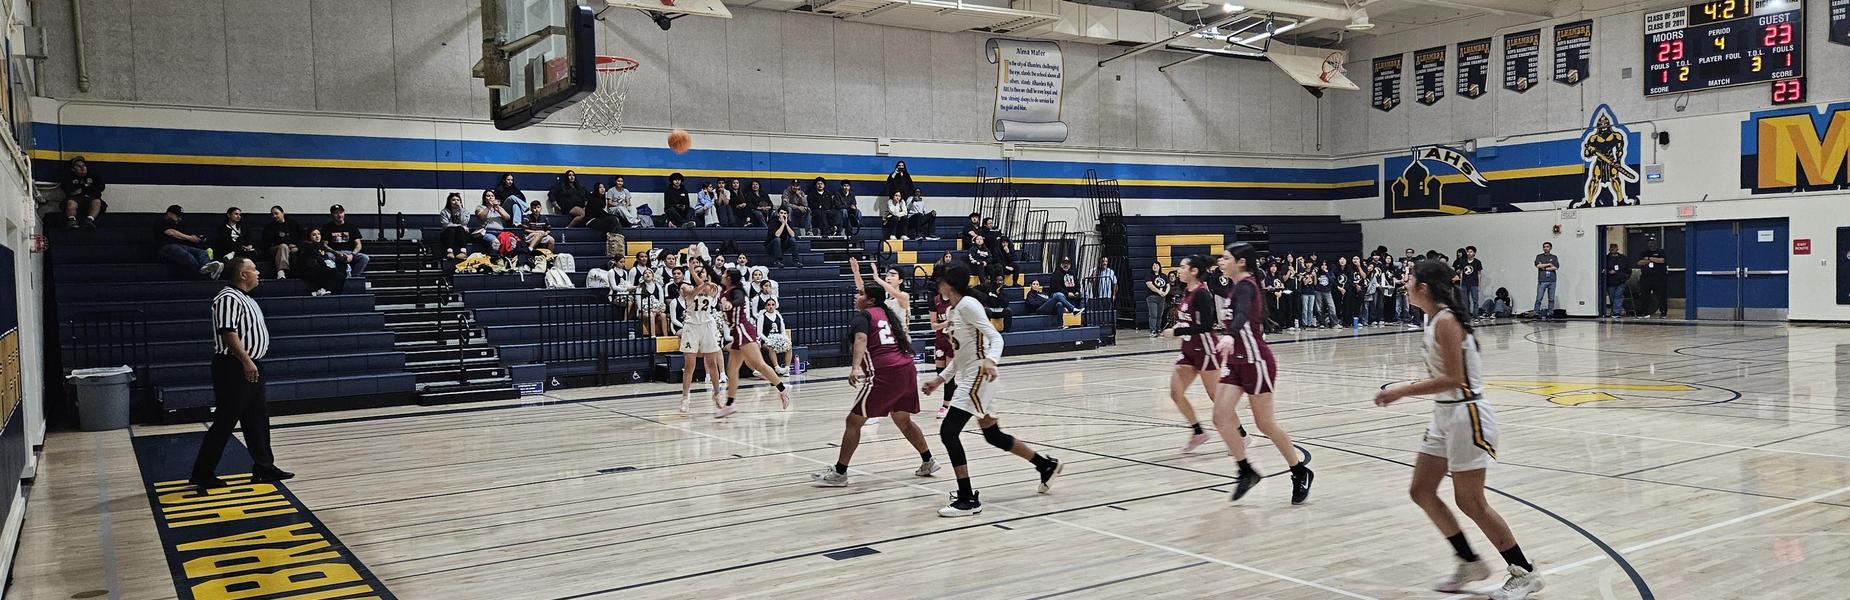
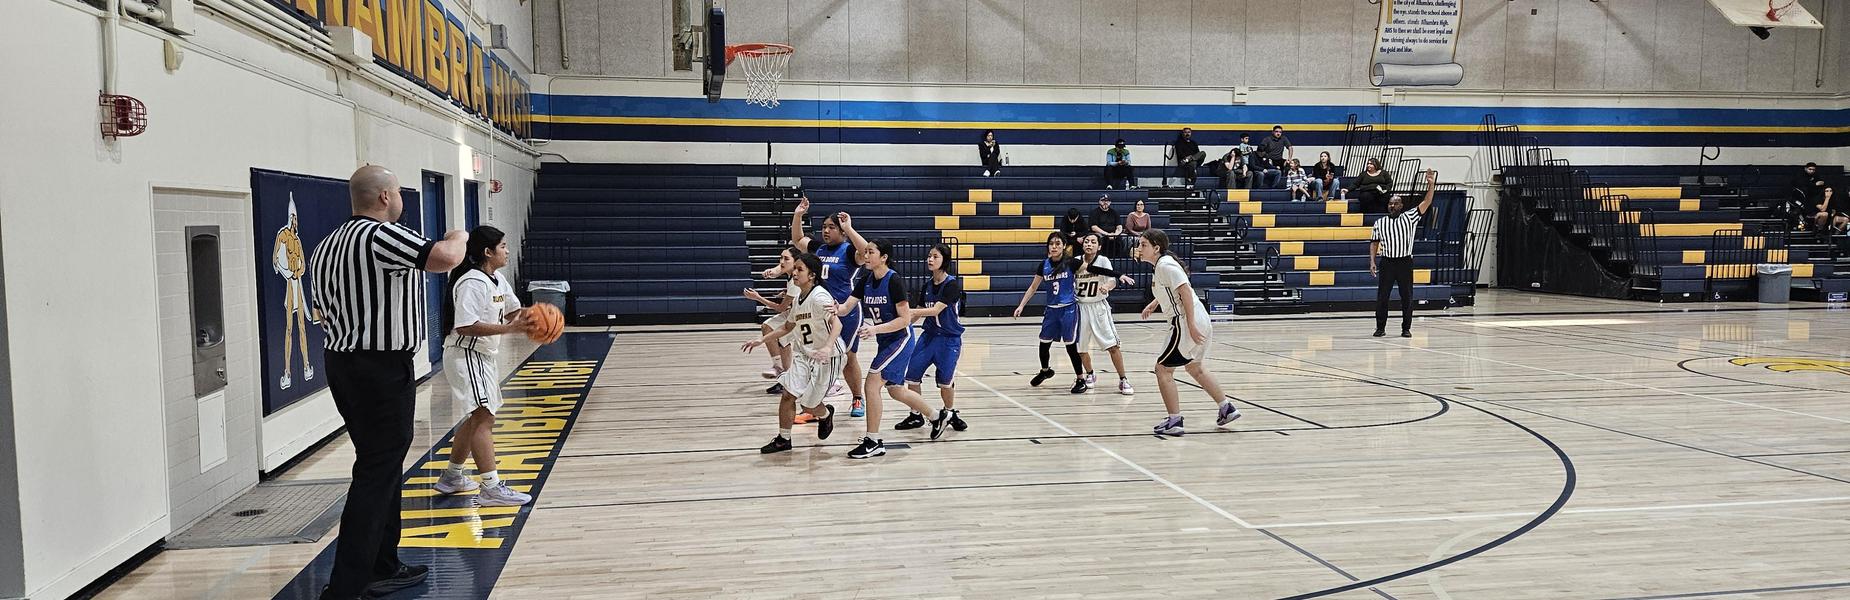
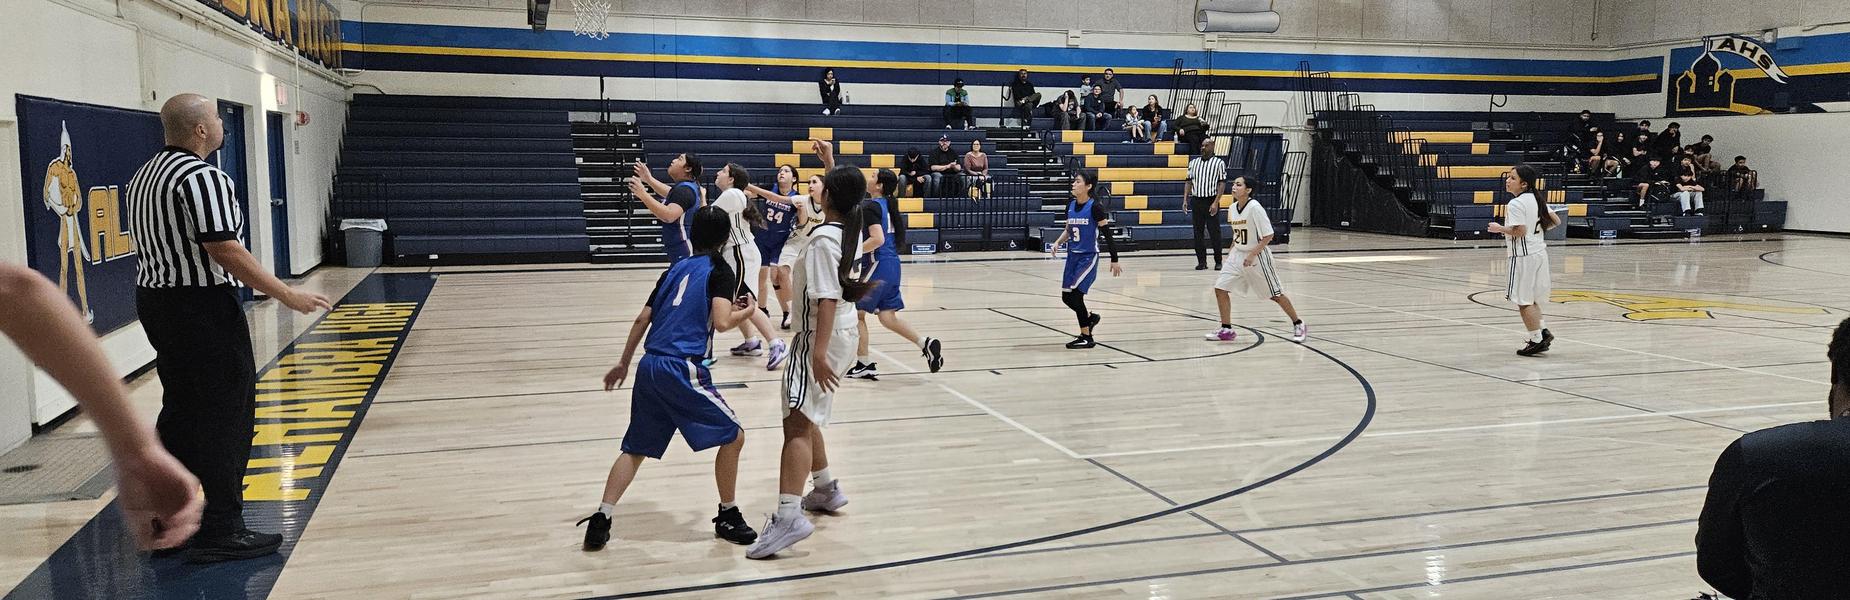
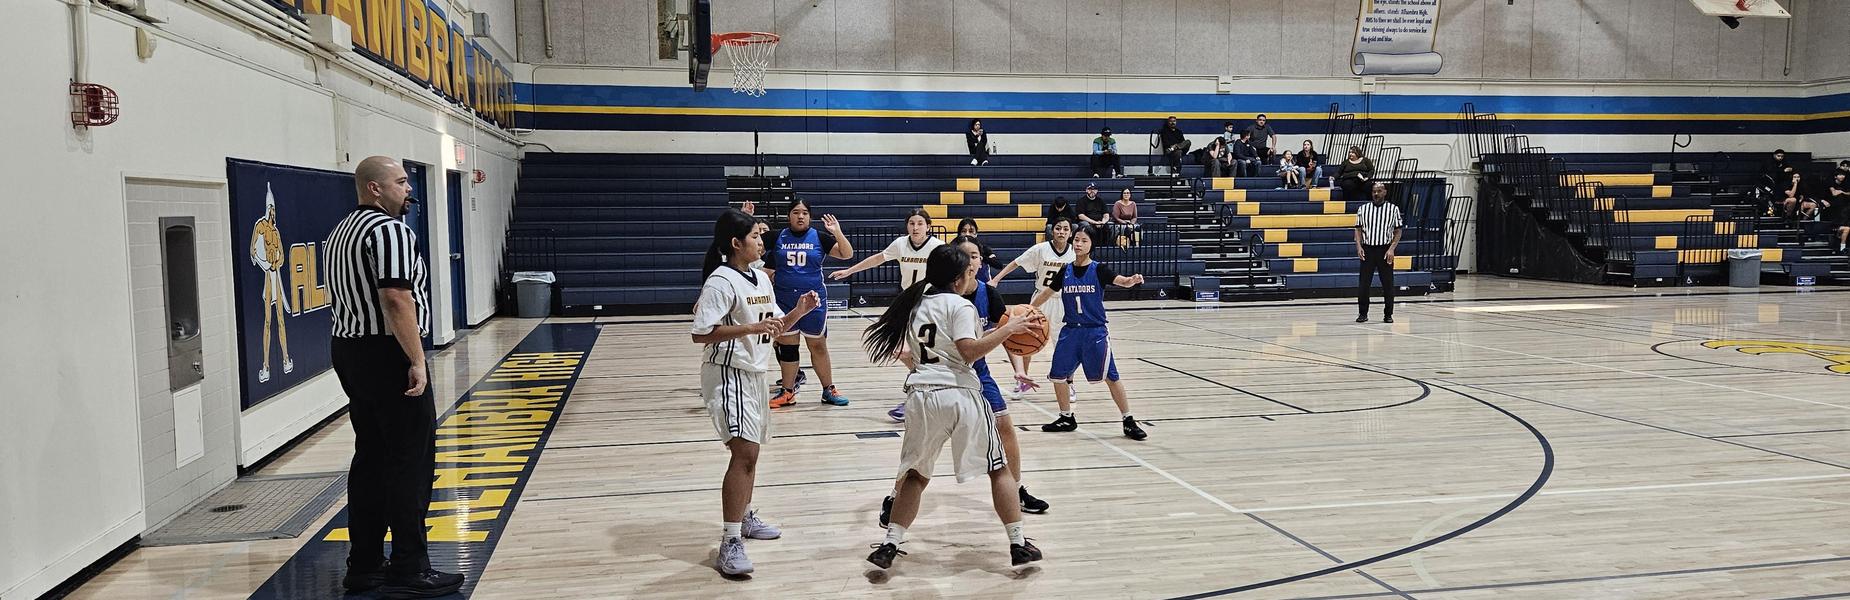
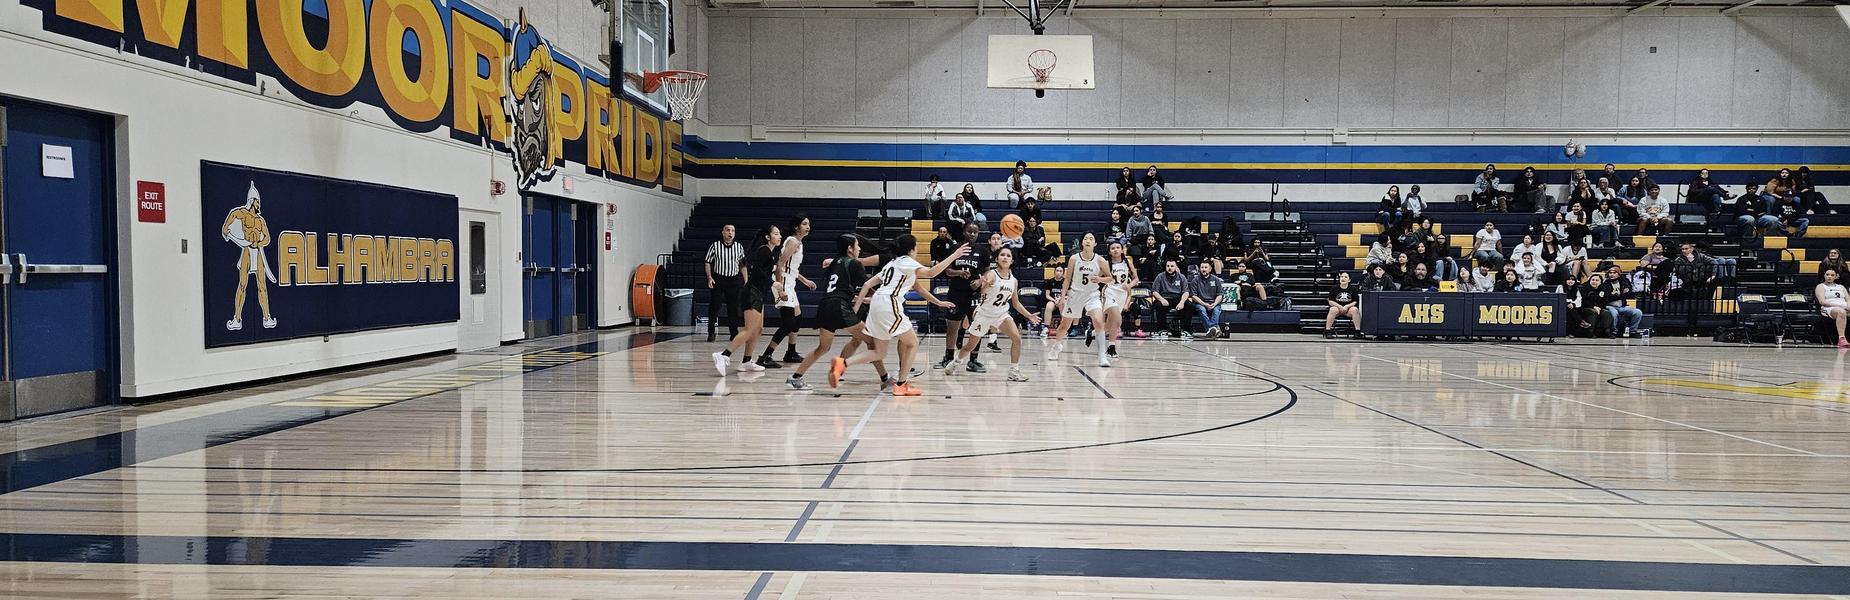
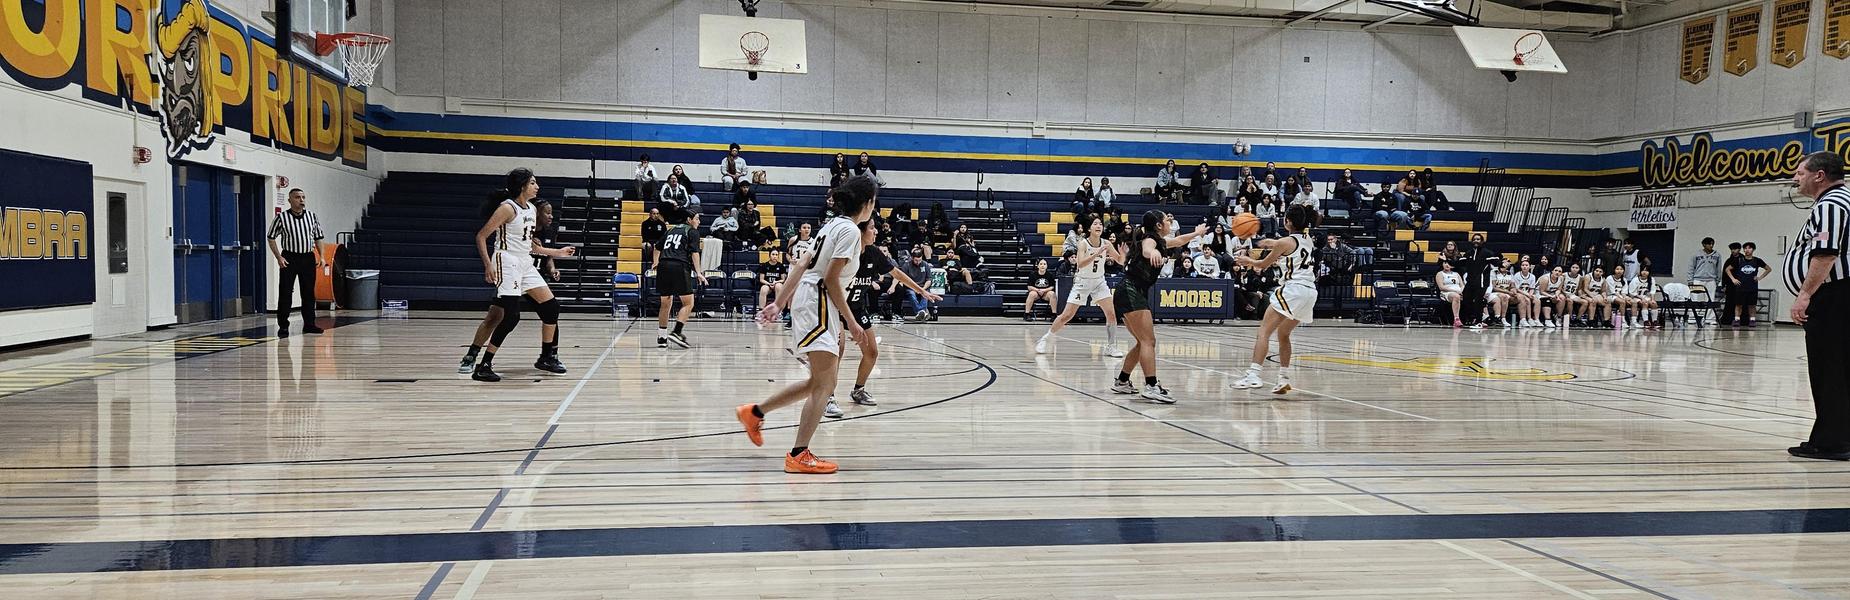
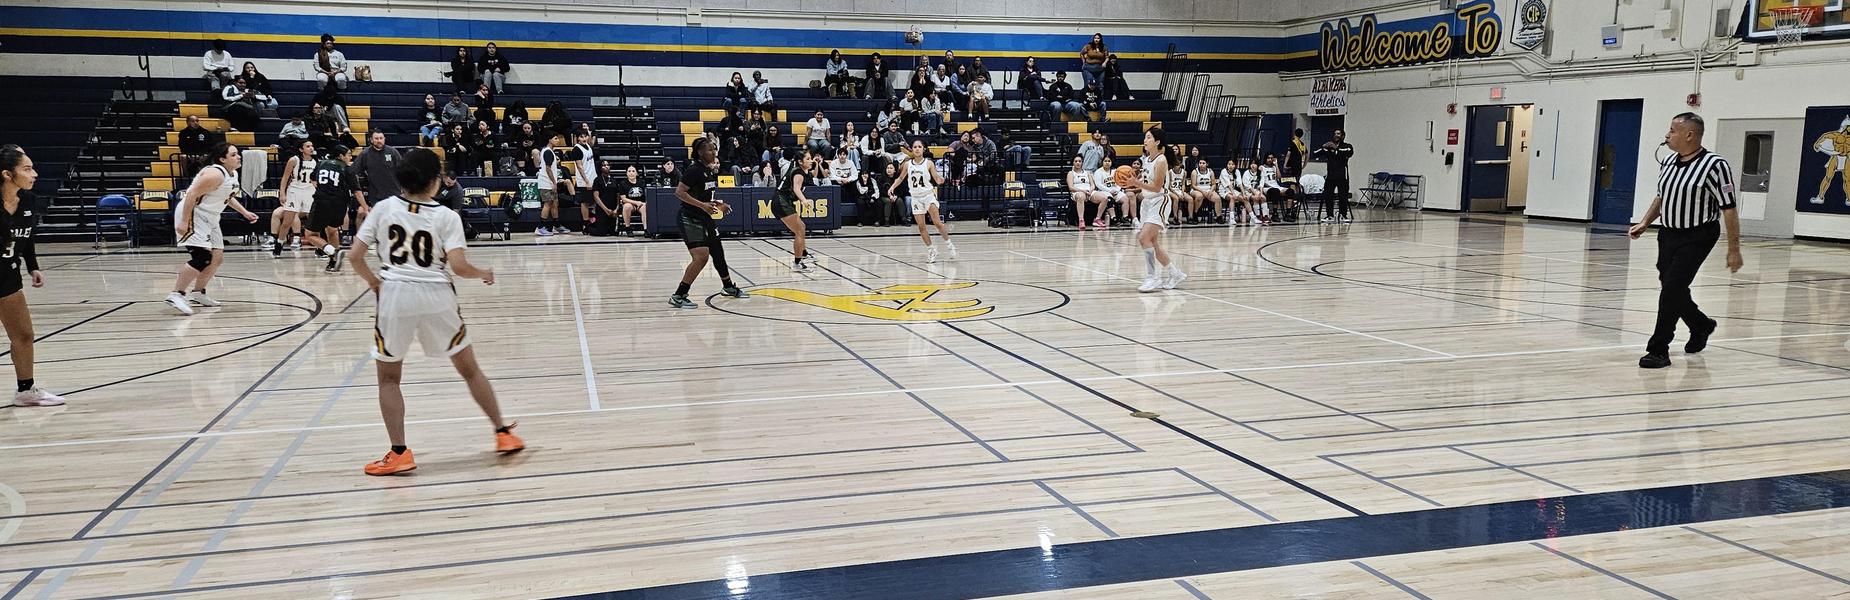
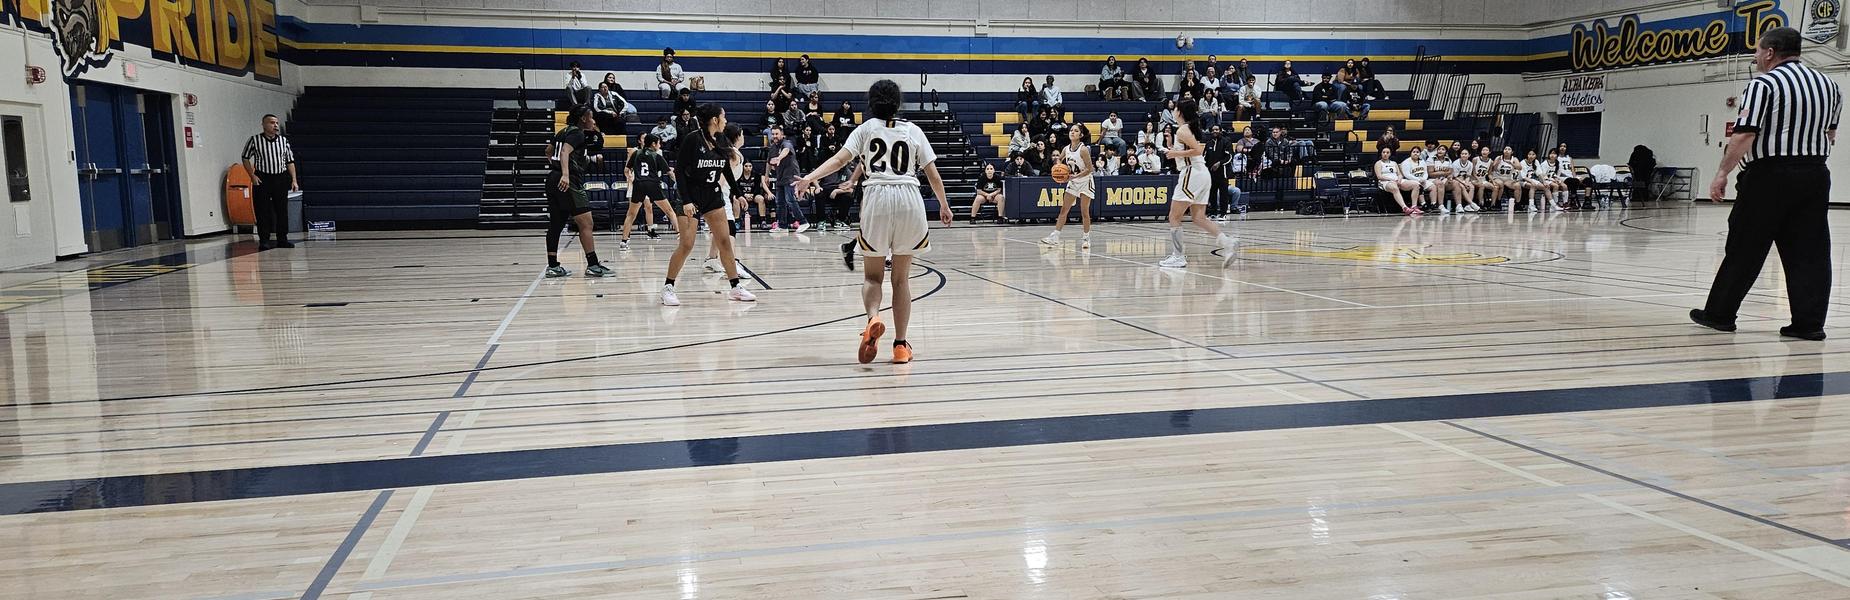
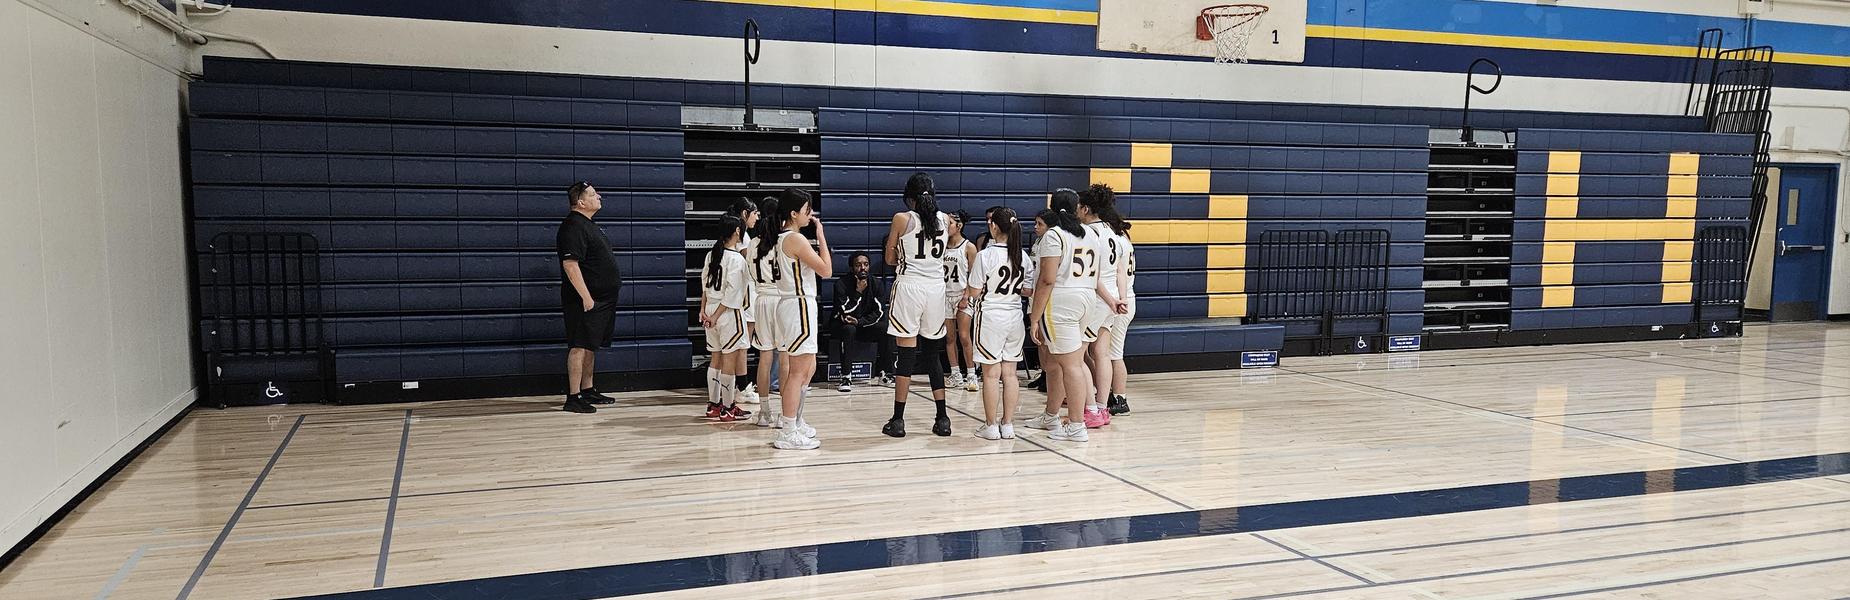
Girls Varsity Basketball
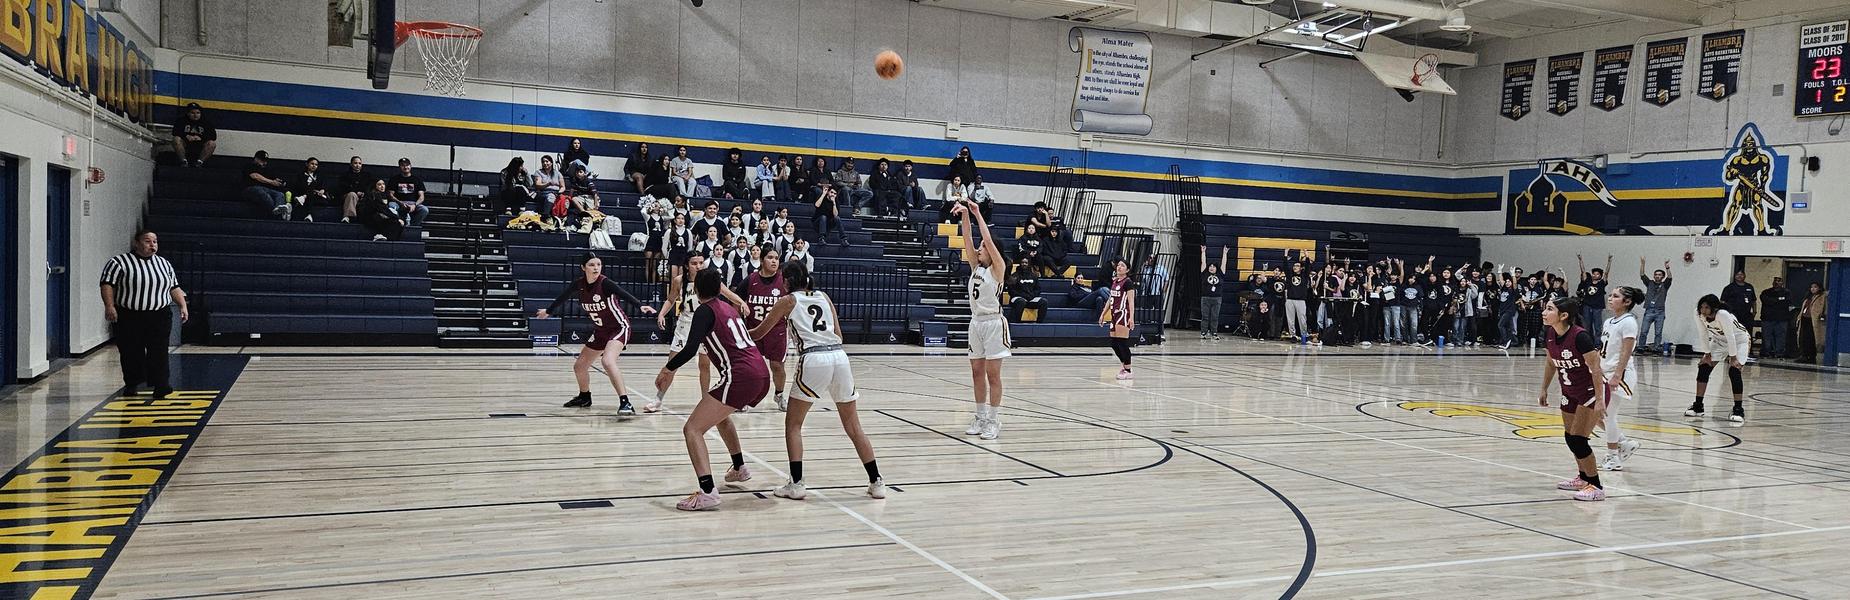
Girls Varsity Basketball
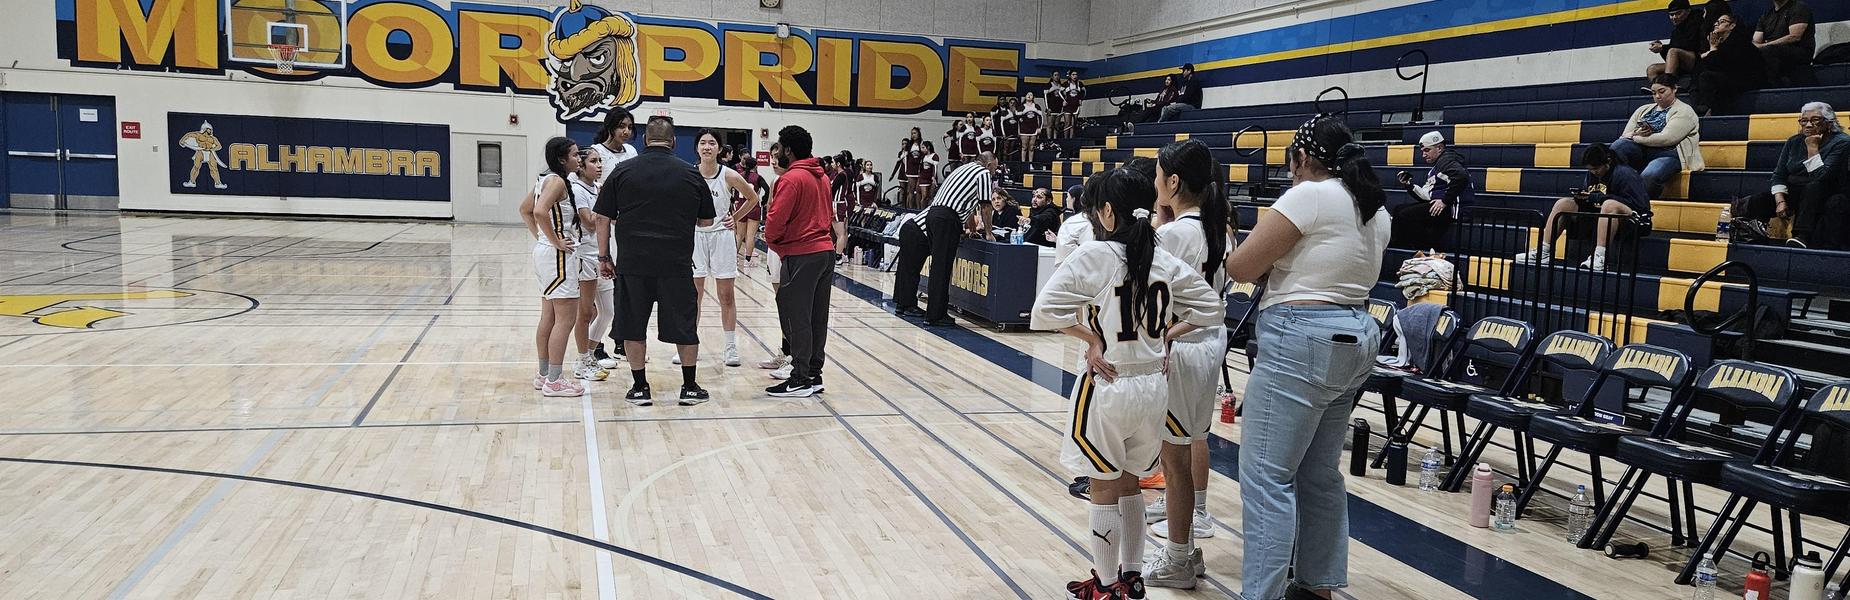
Girls Varsity Basketball
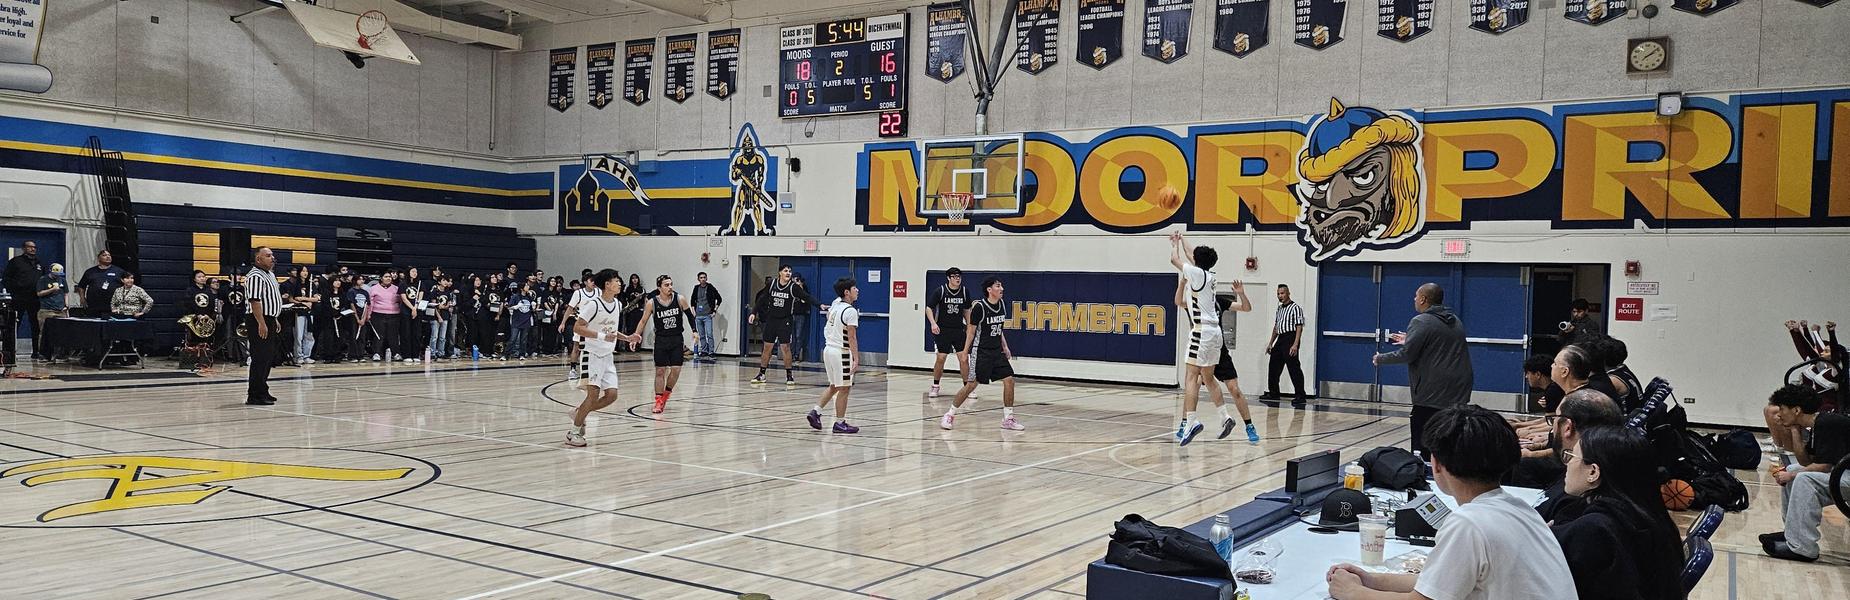
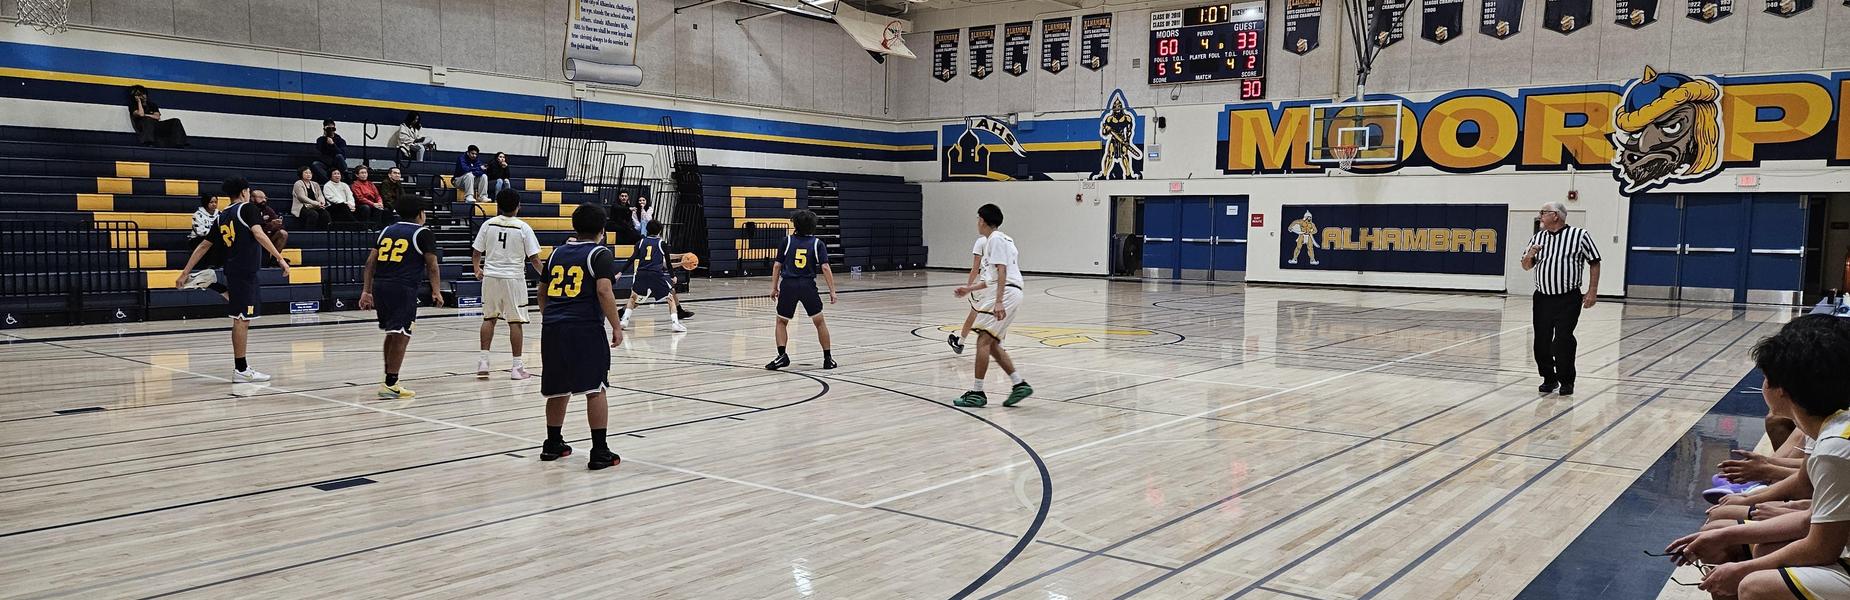
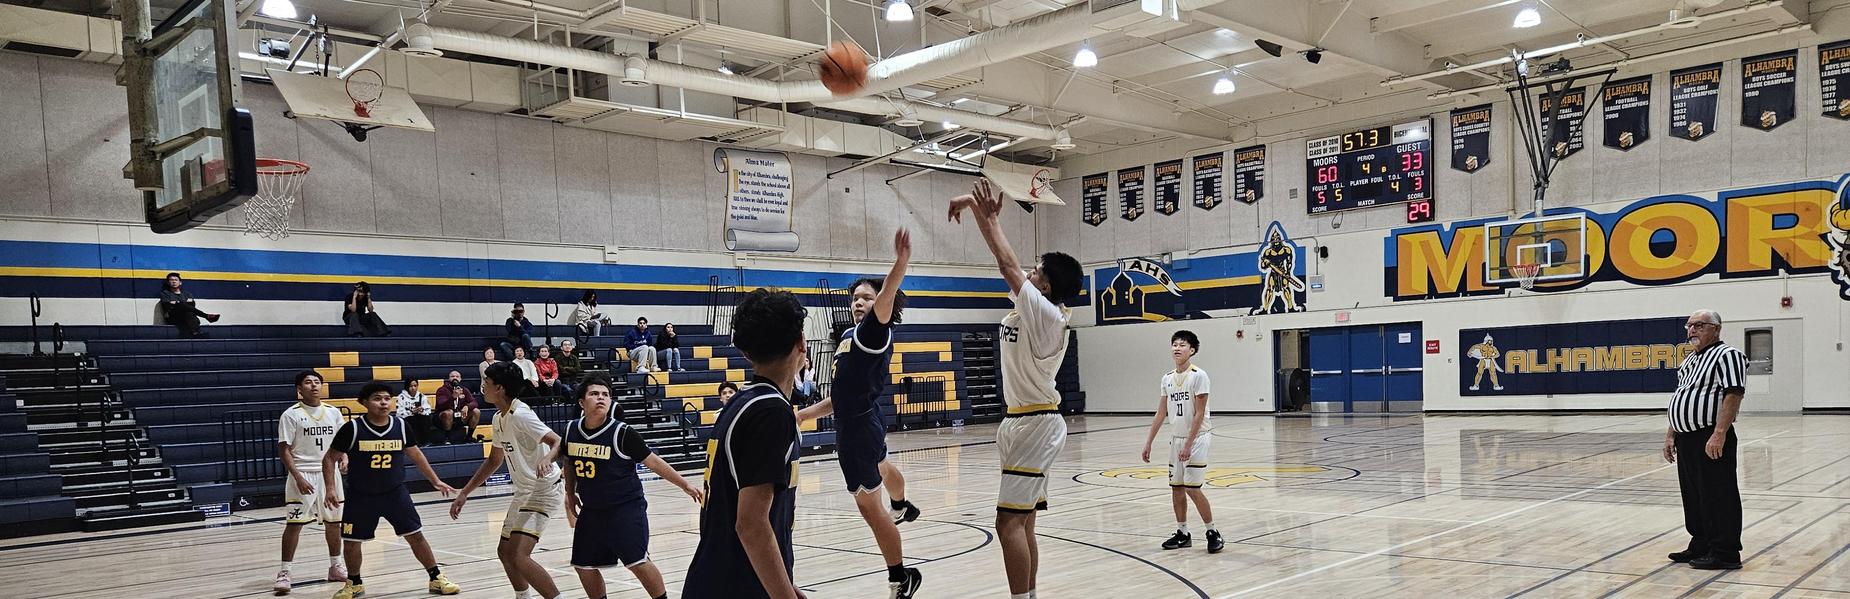
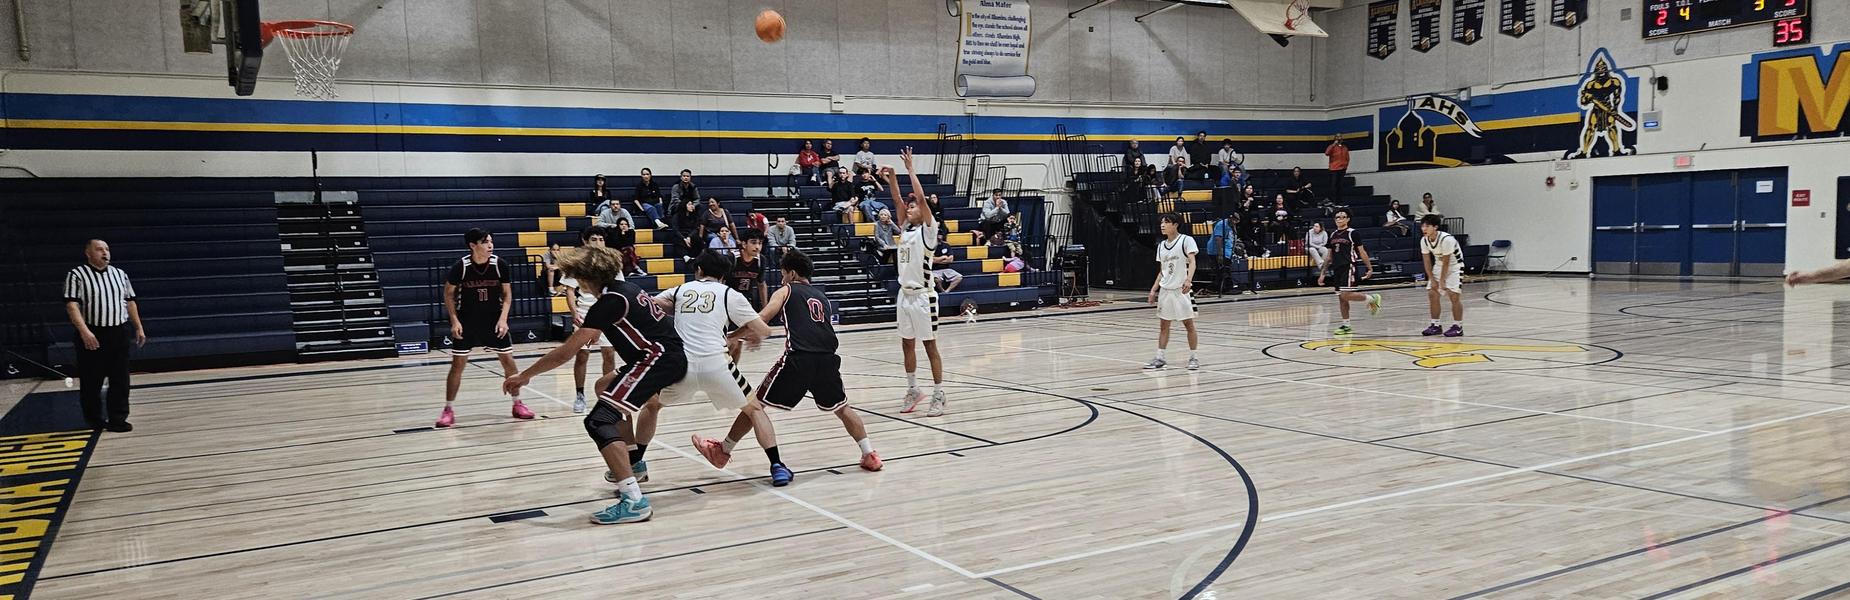
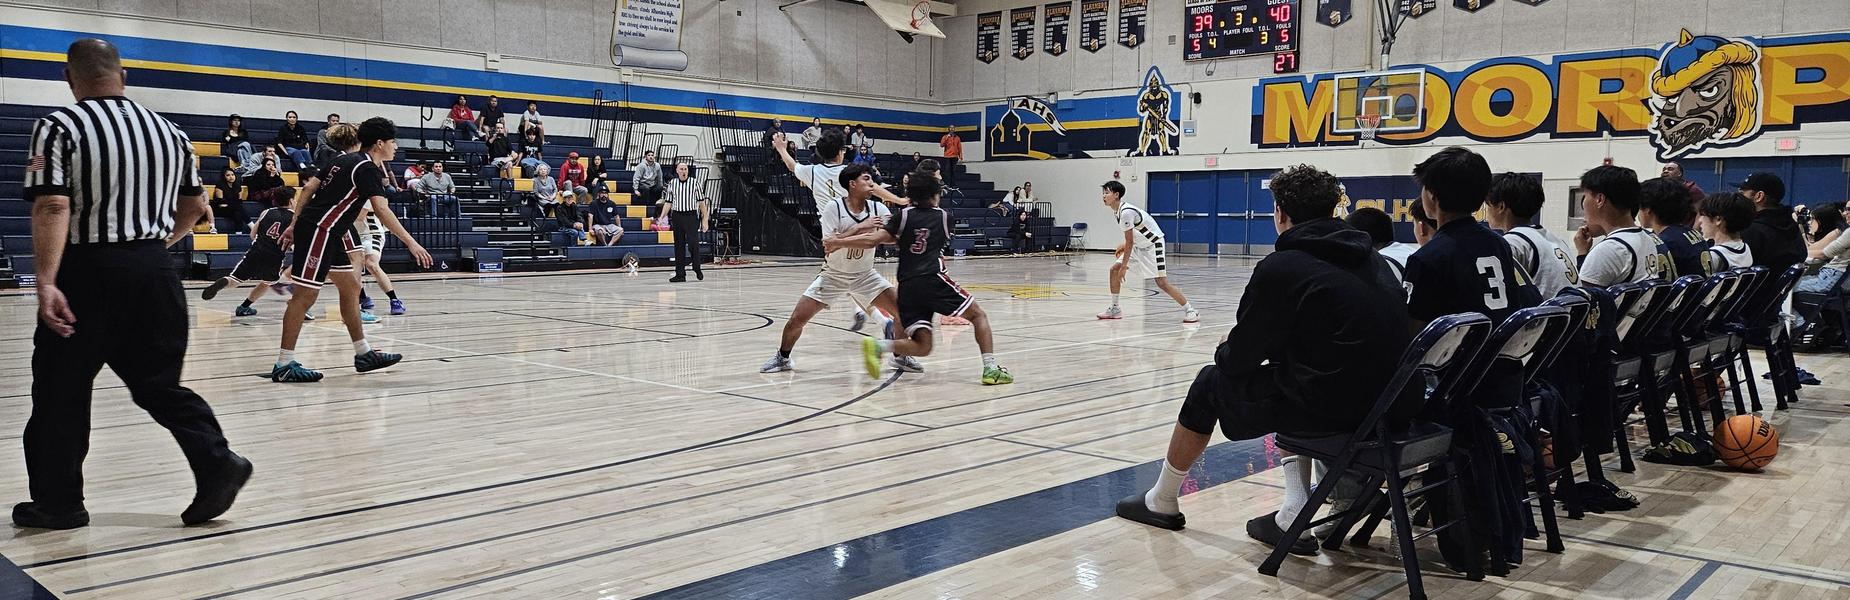
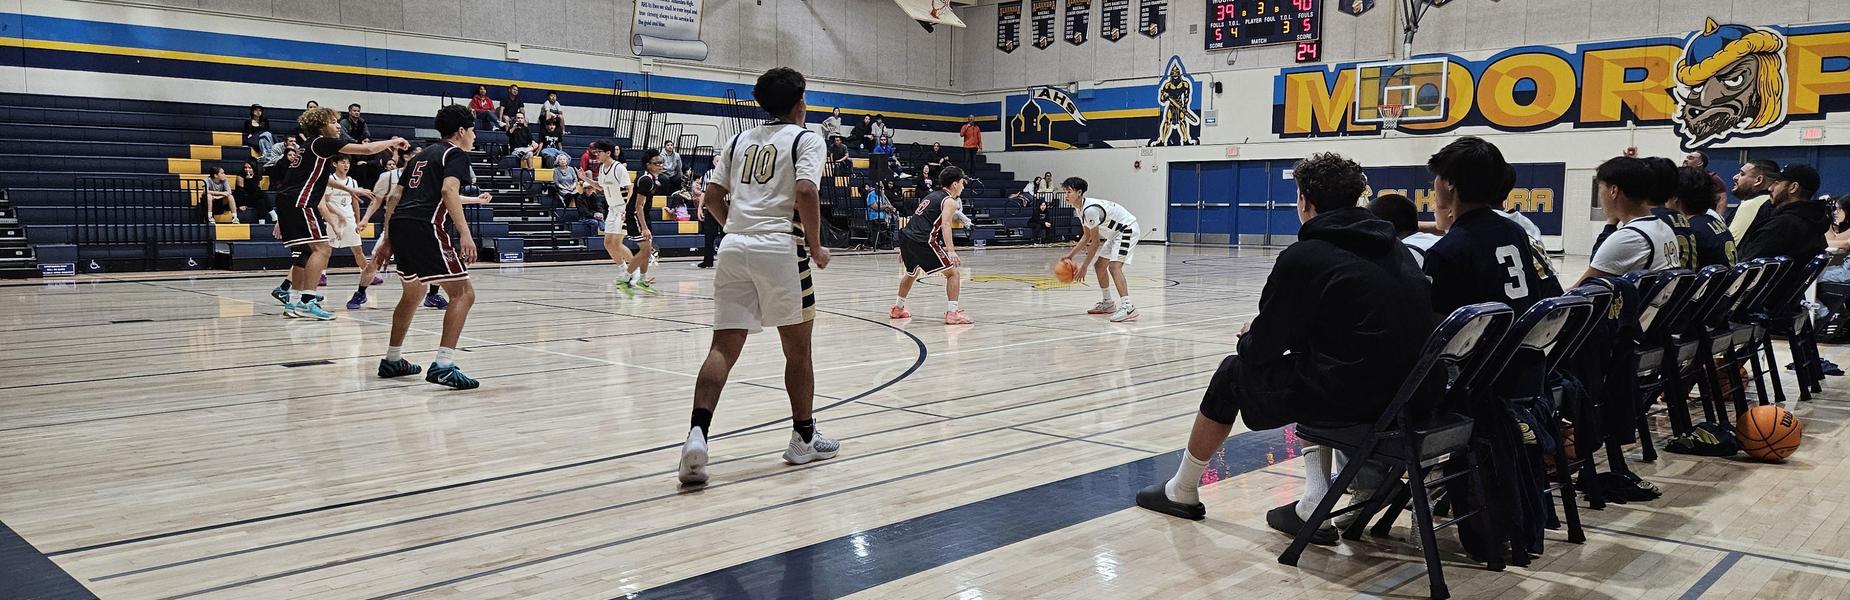
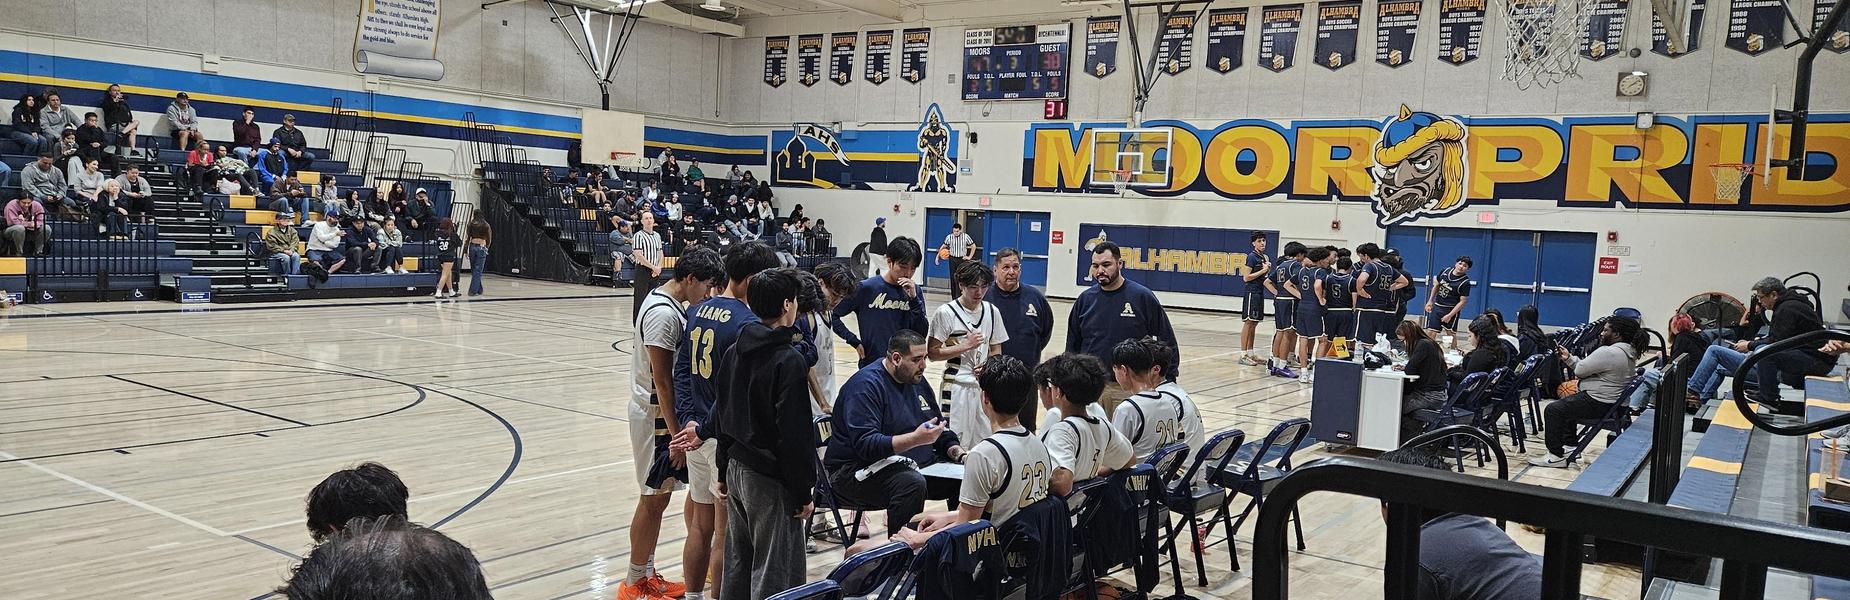
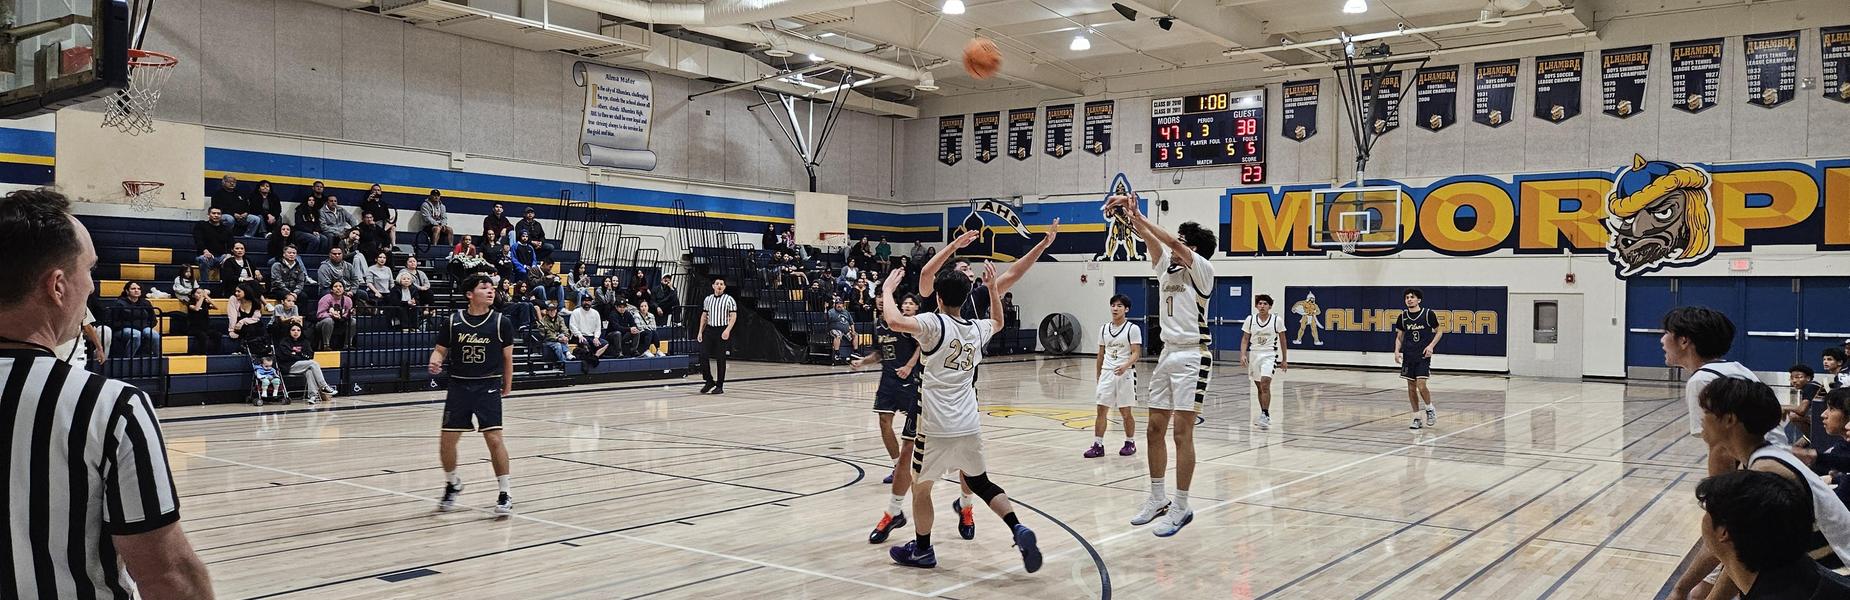
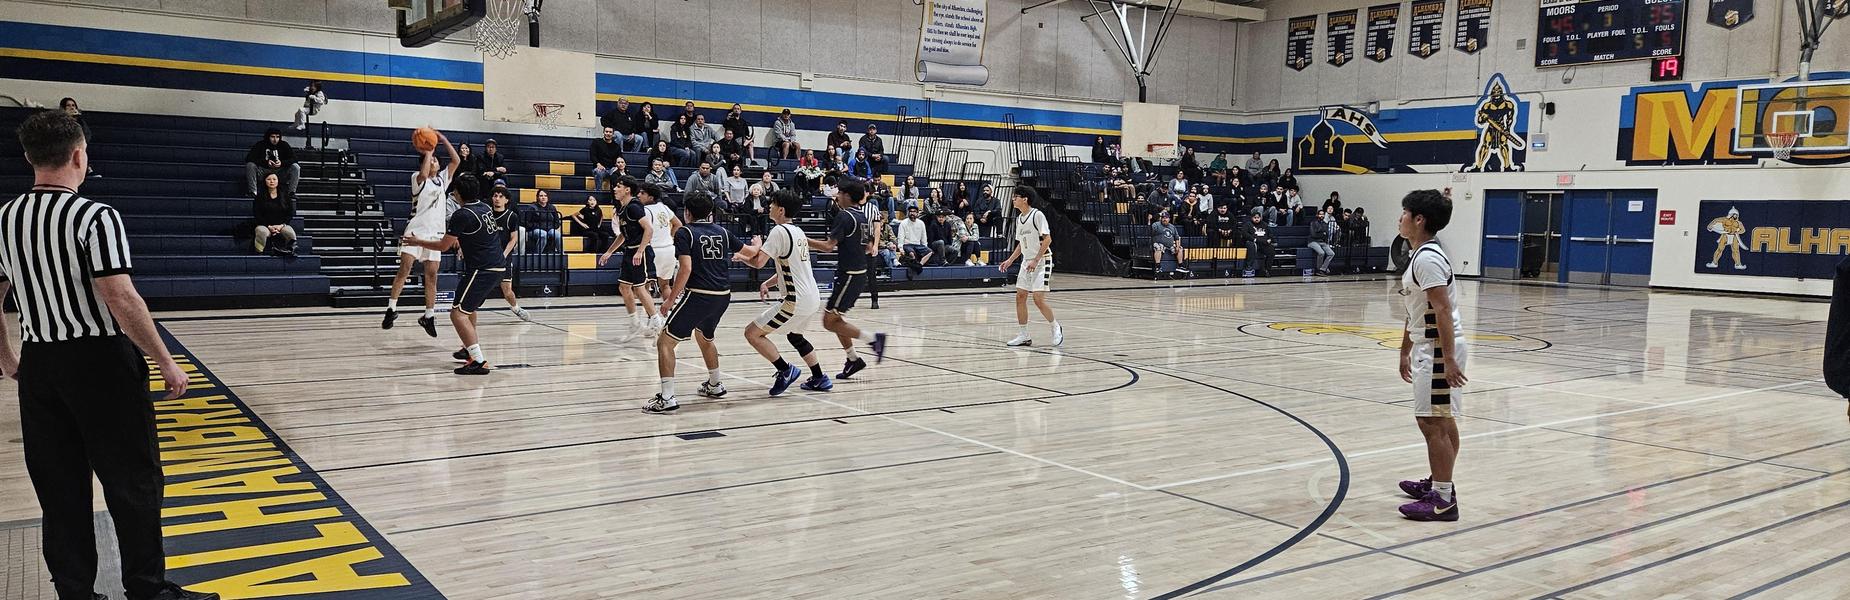
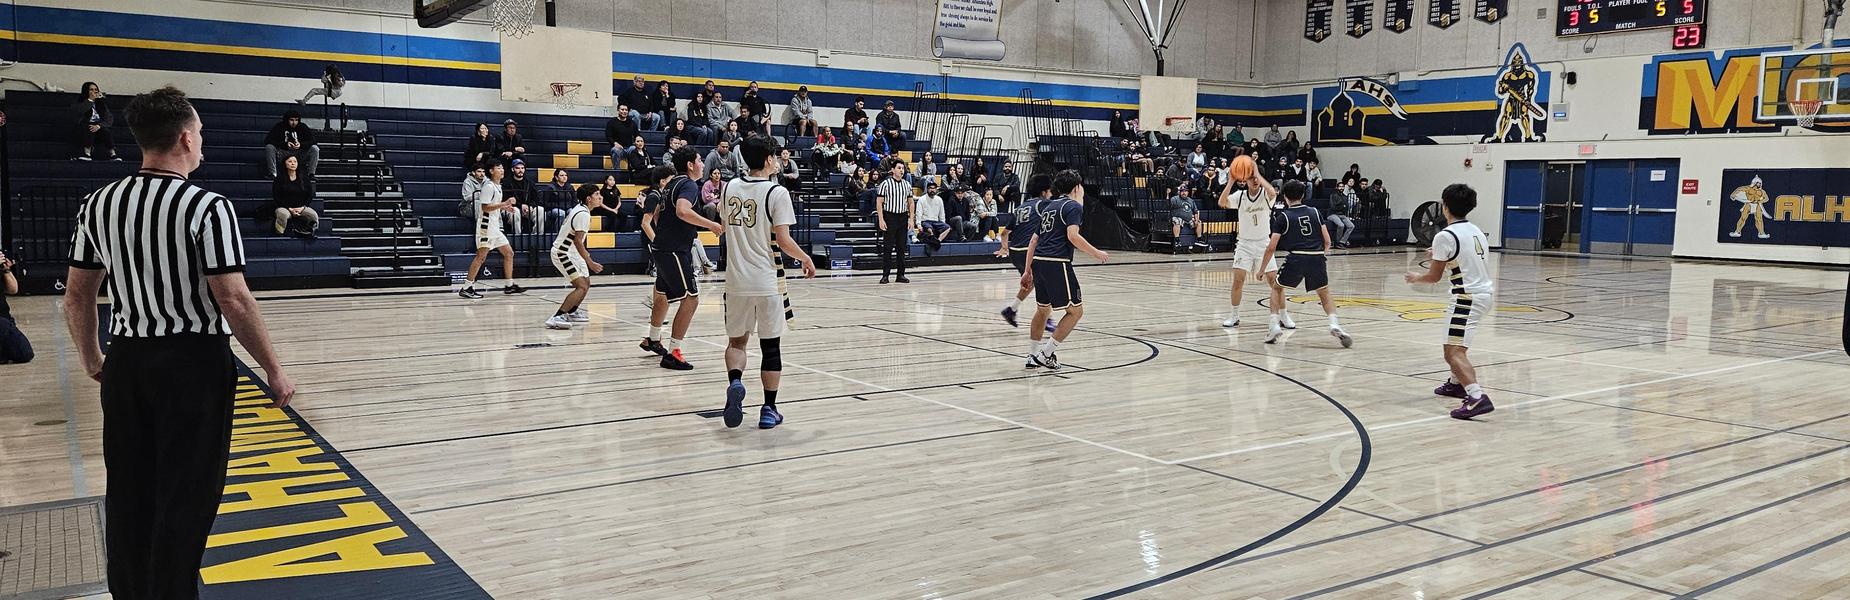
Boys Varsity Basketball
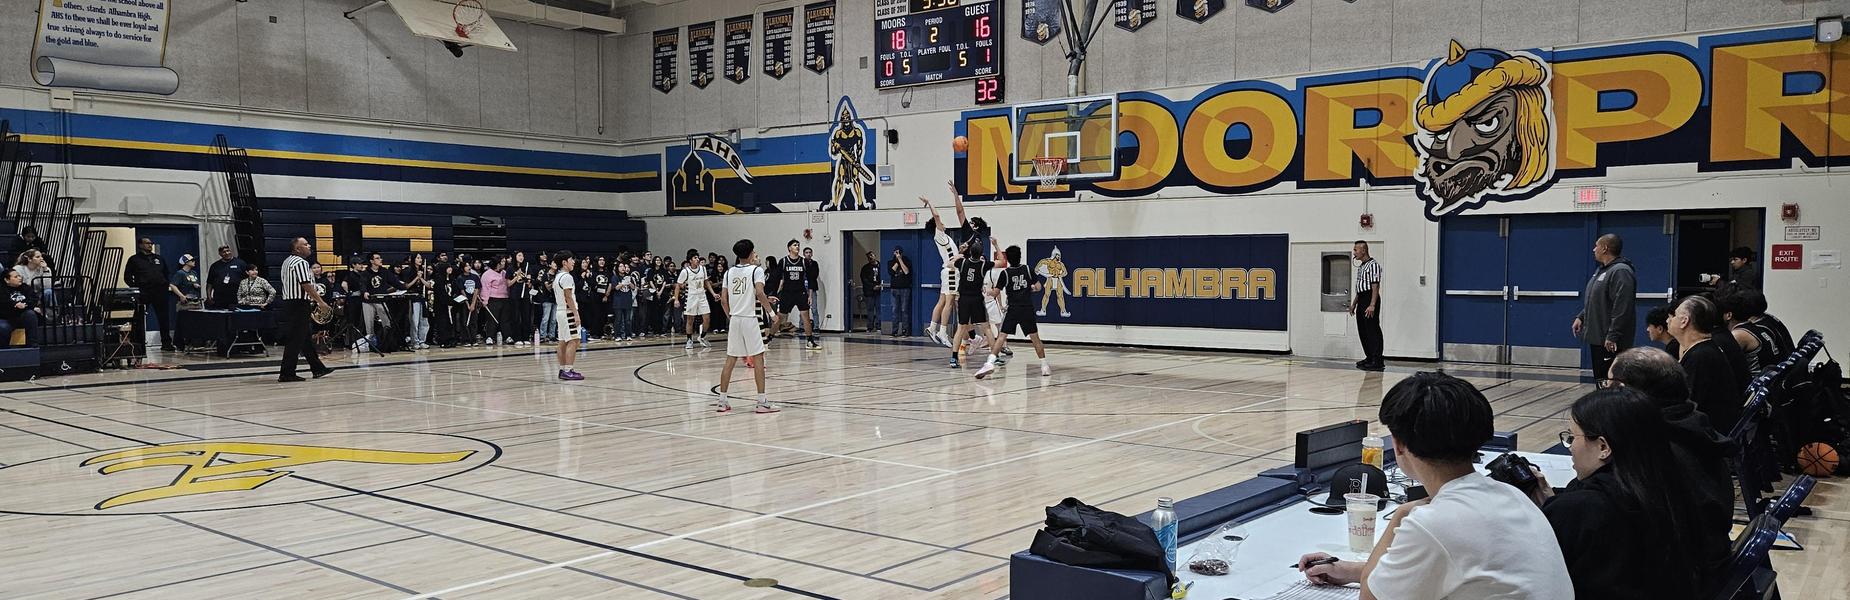
Boys Varsity Basketball
Boys Varsity Basketball
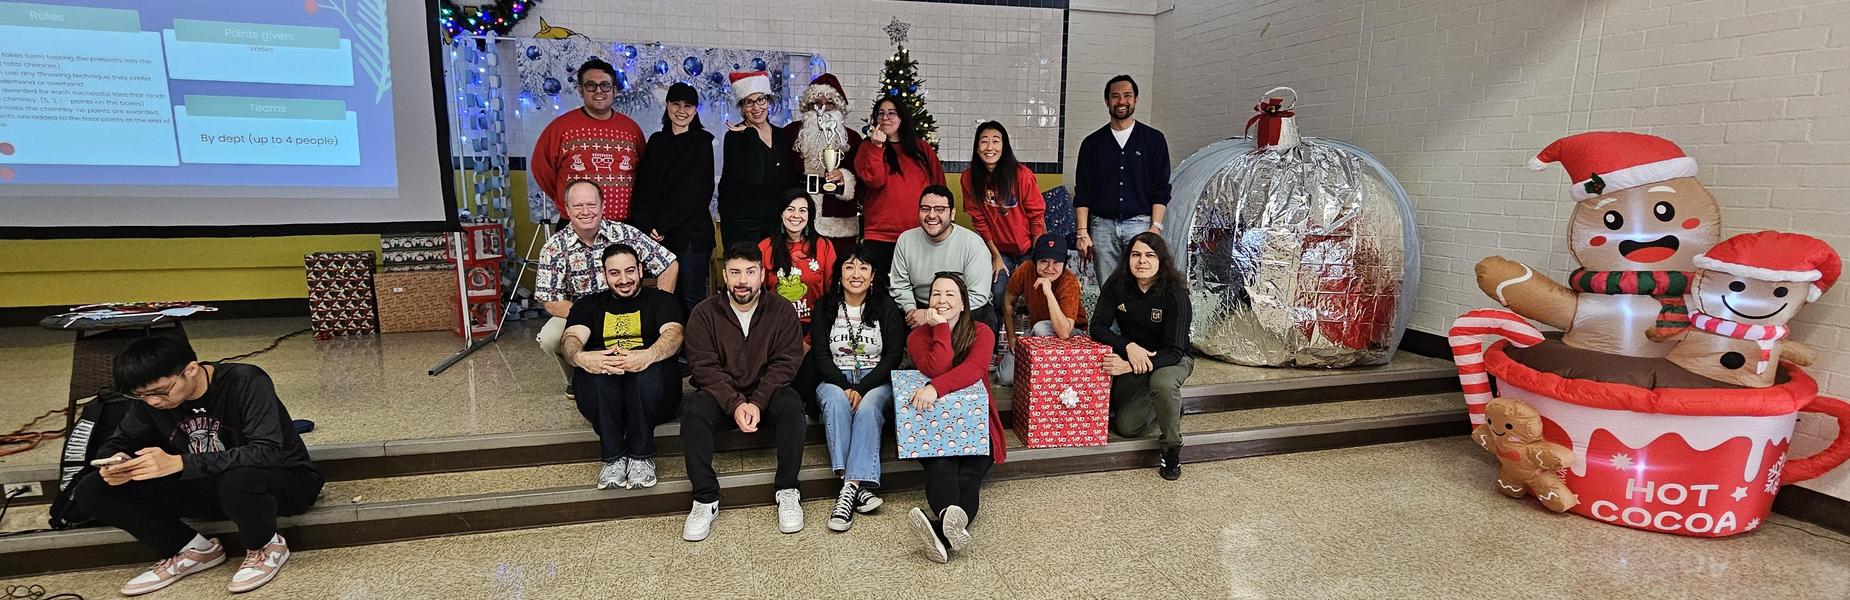
The Reindeer Games Winners - The Special Ed. Department!
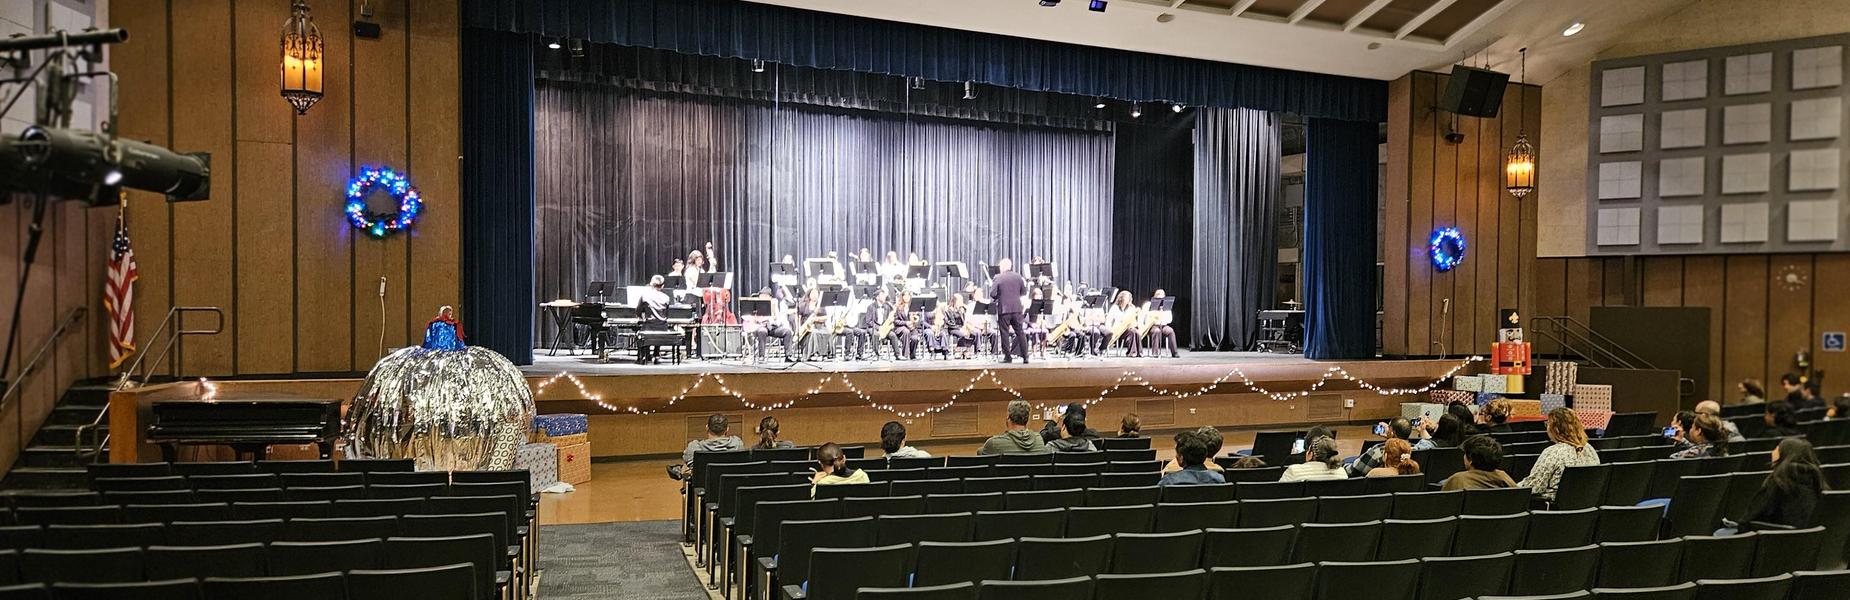
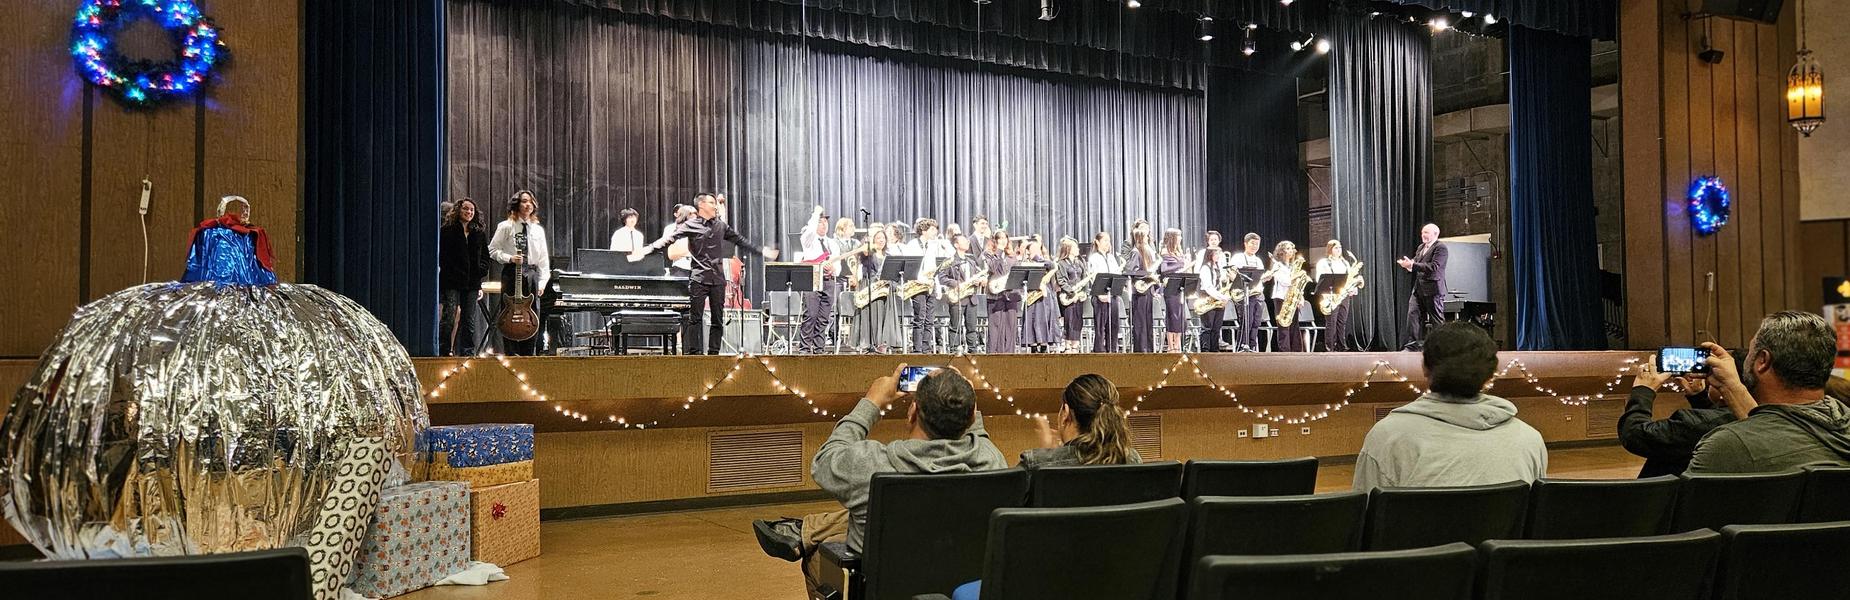
Jazz Band Winter Concert

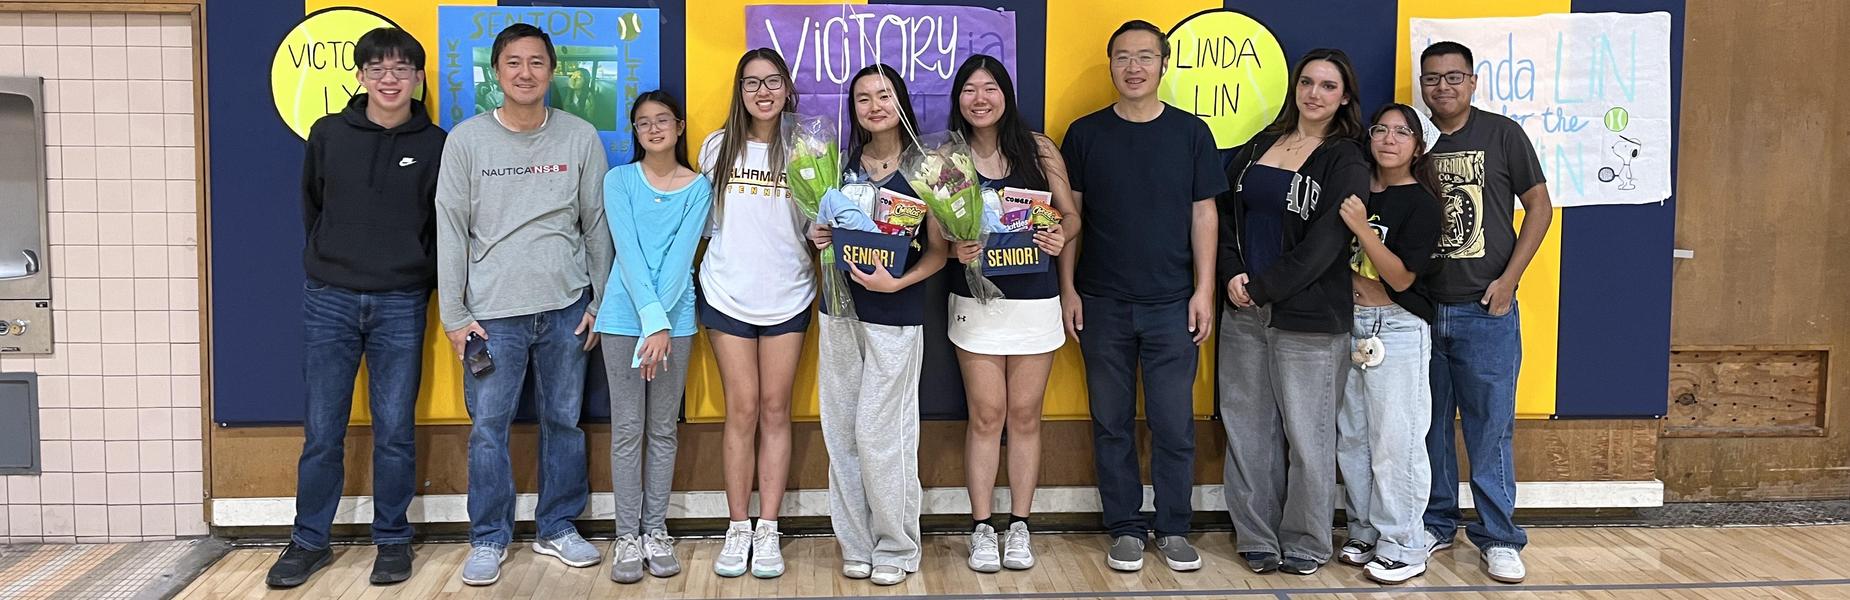
Girls Tennis Banquet
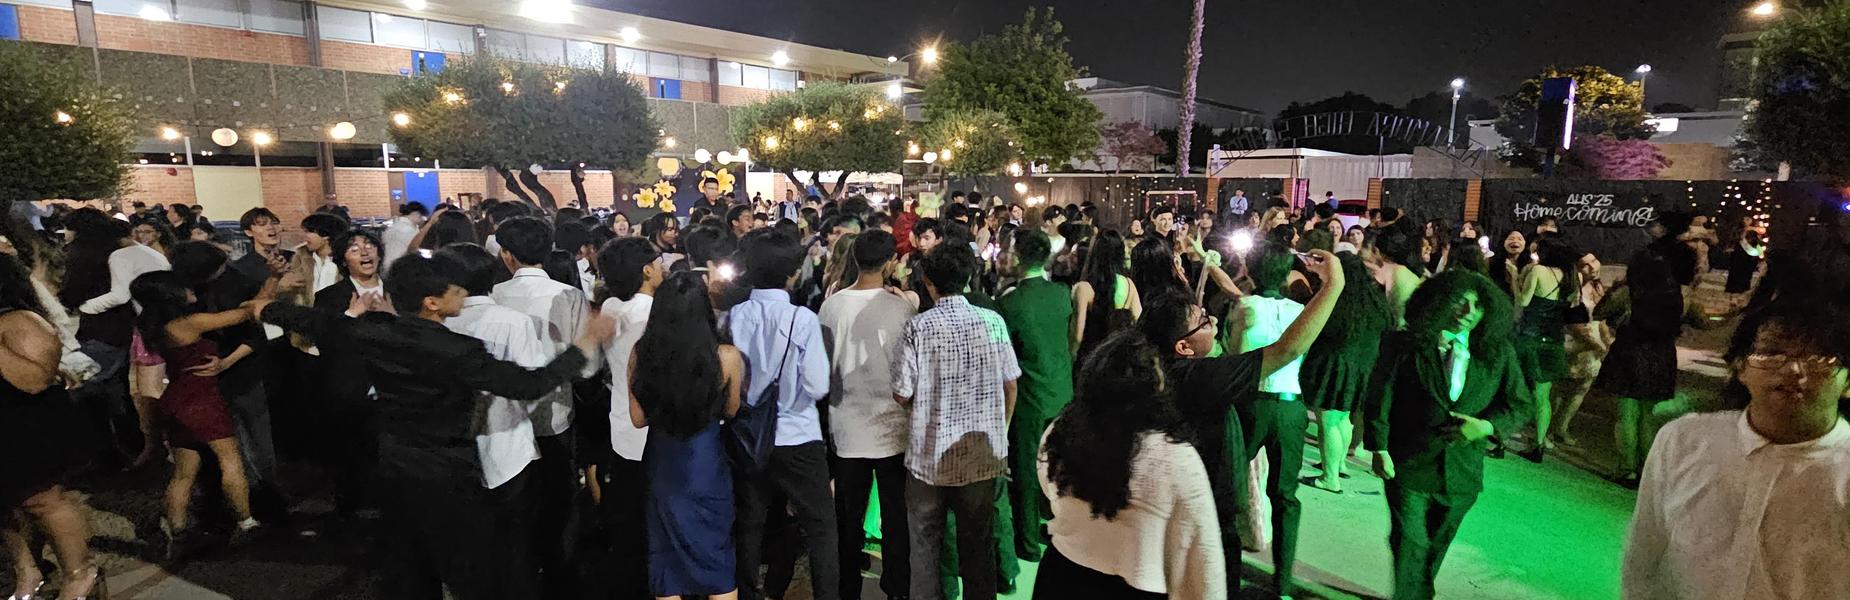
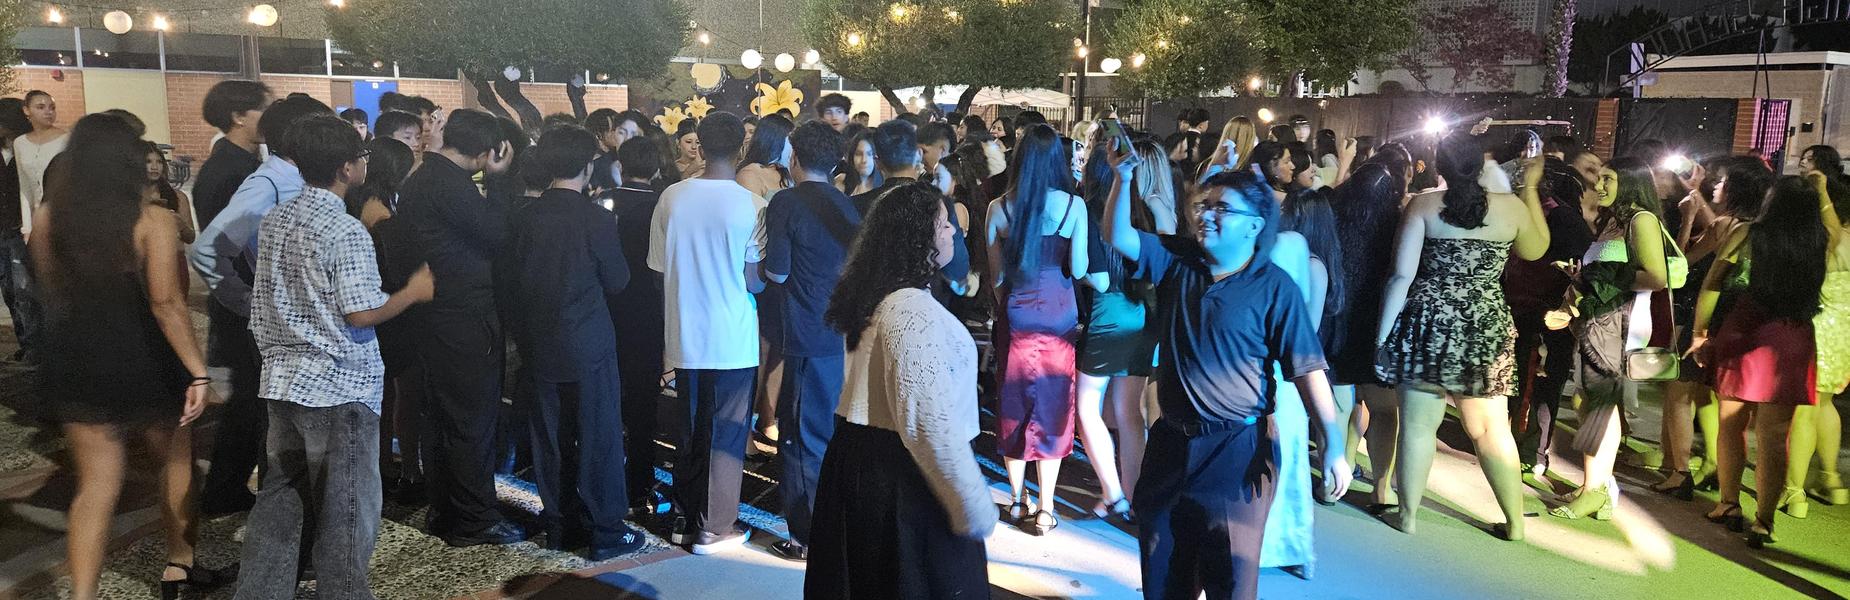
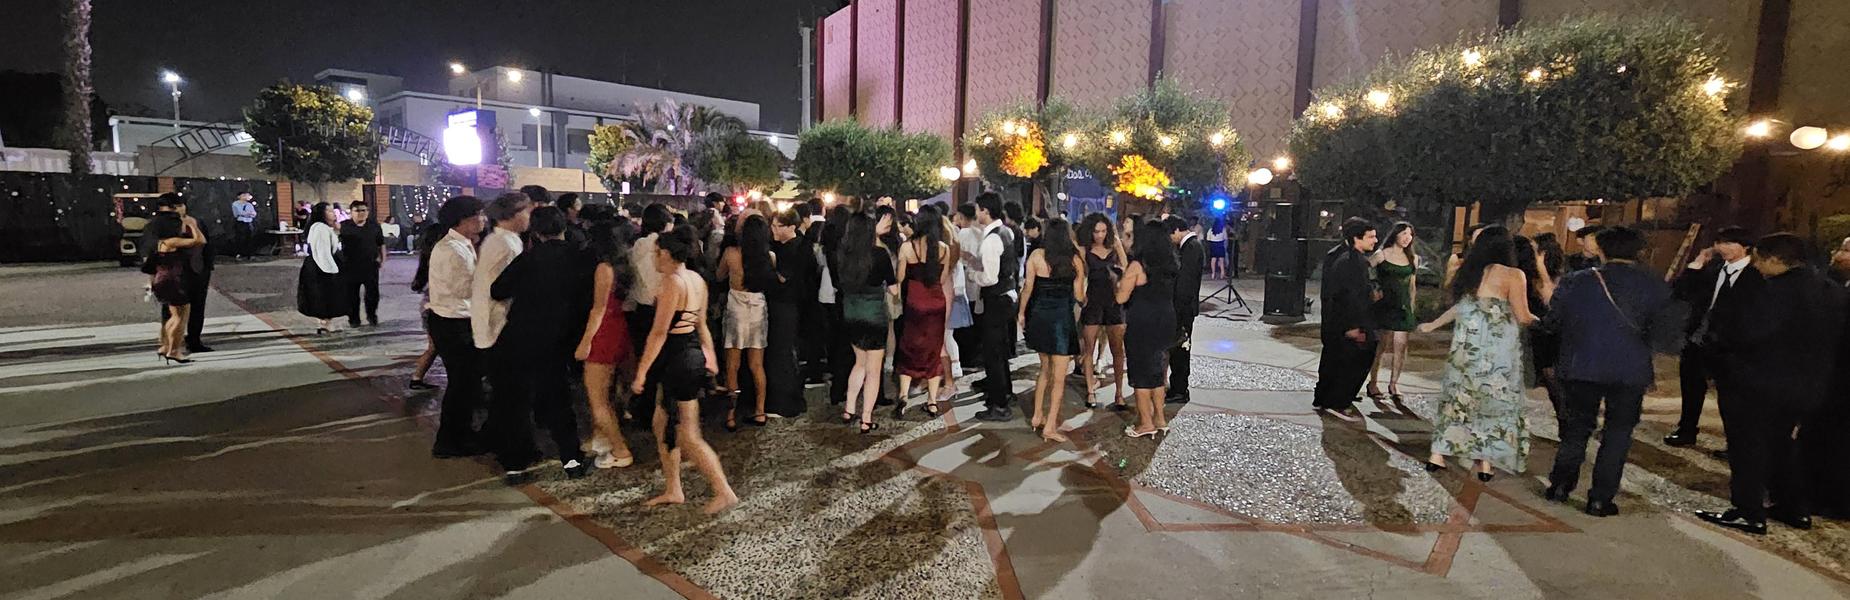
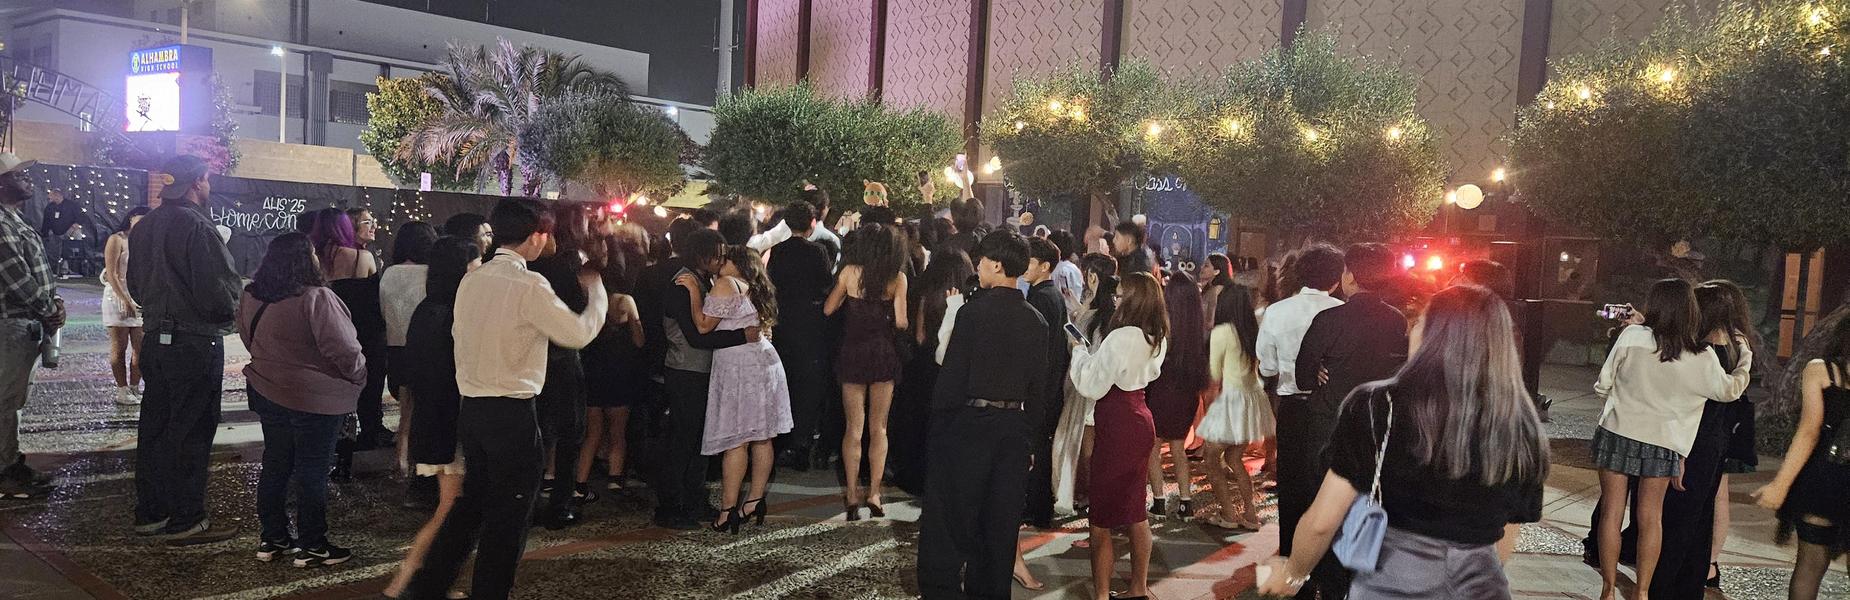
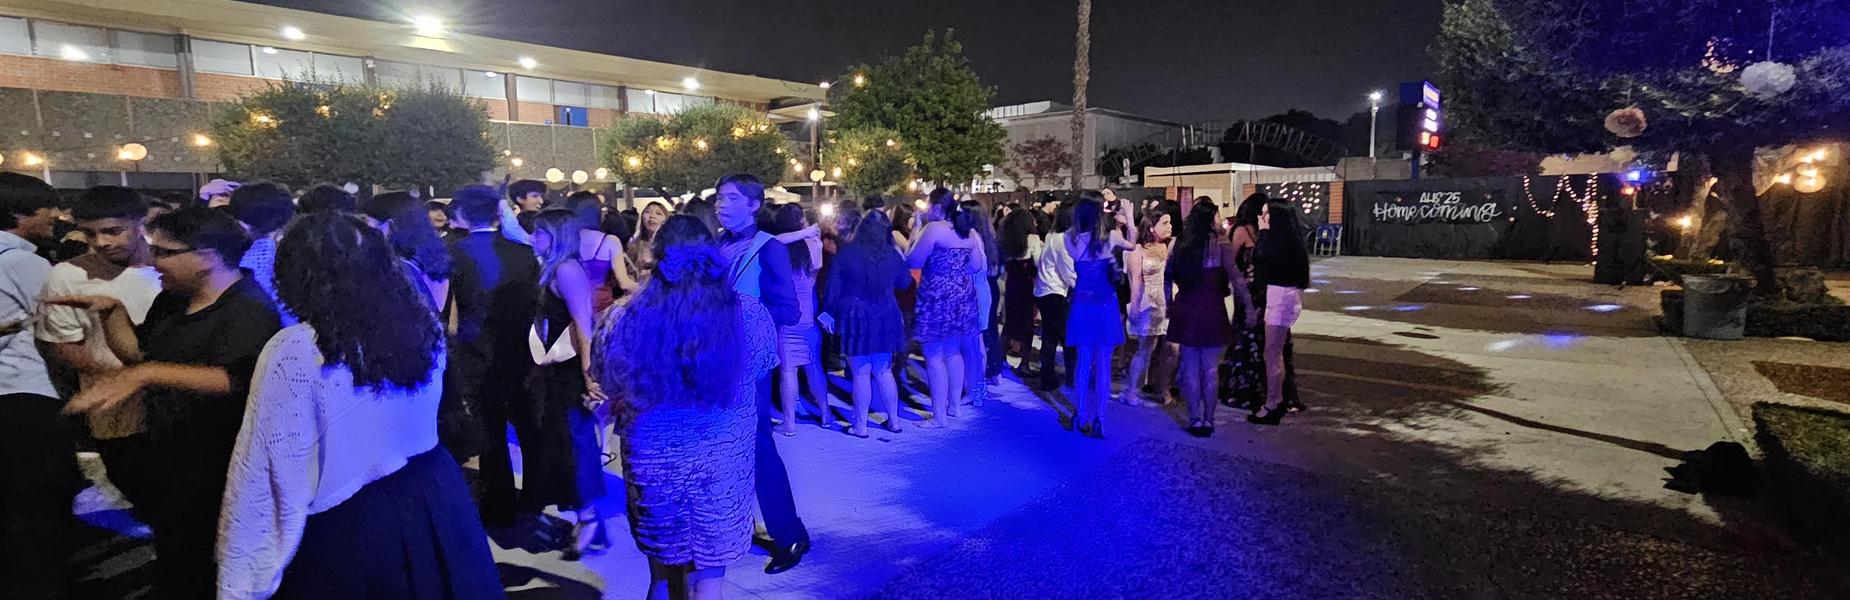
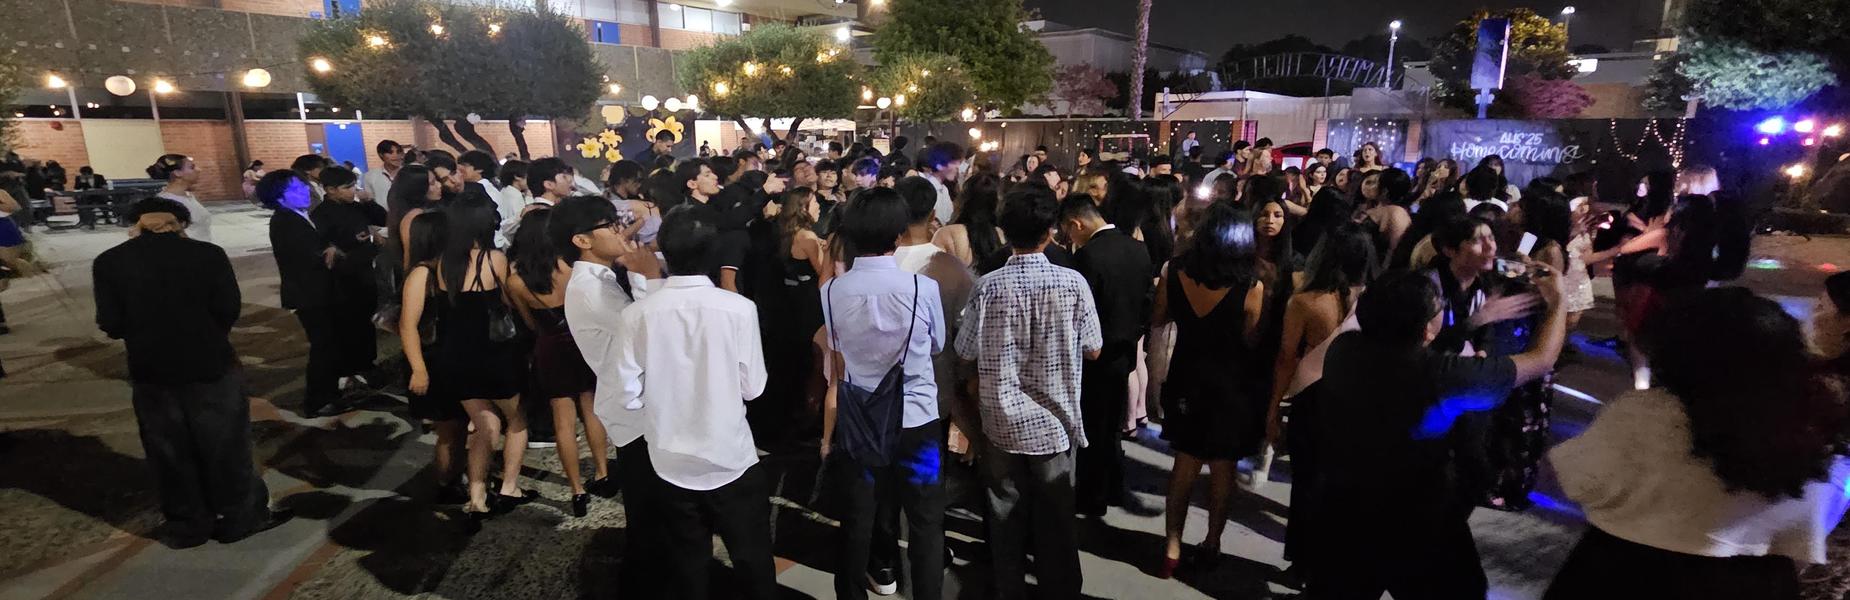
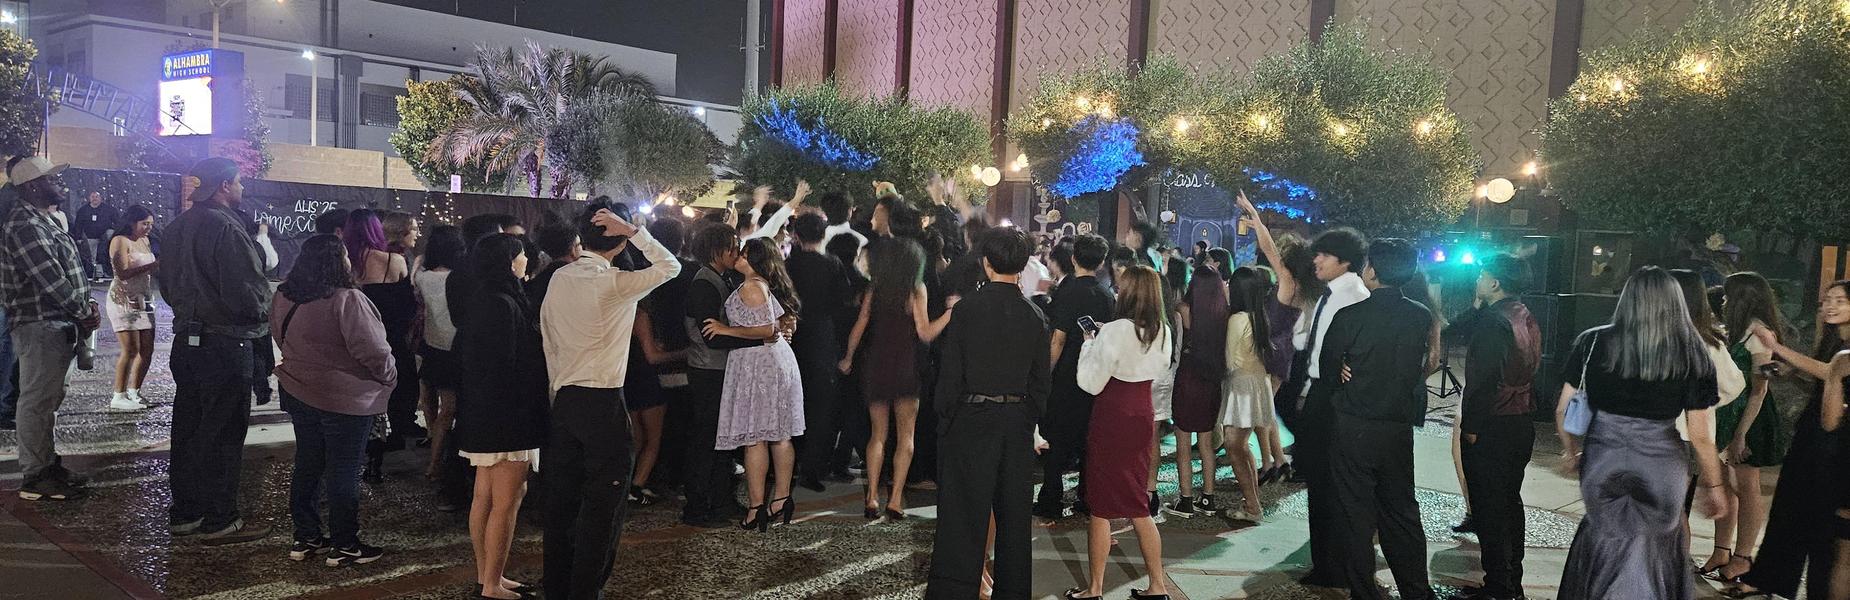
It's Homecoming 2025!!!
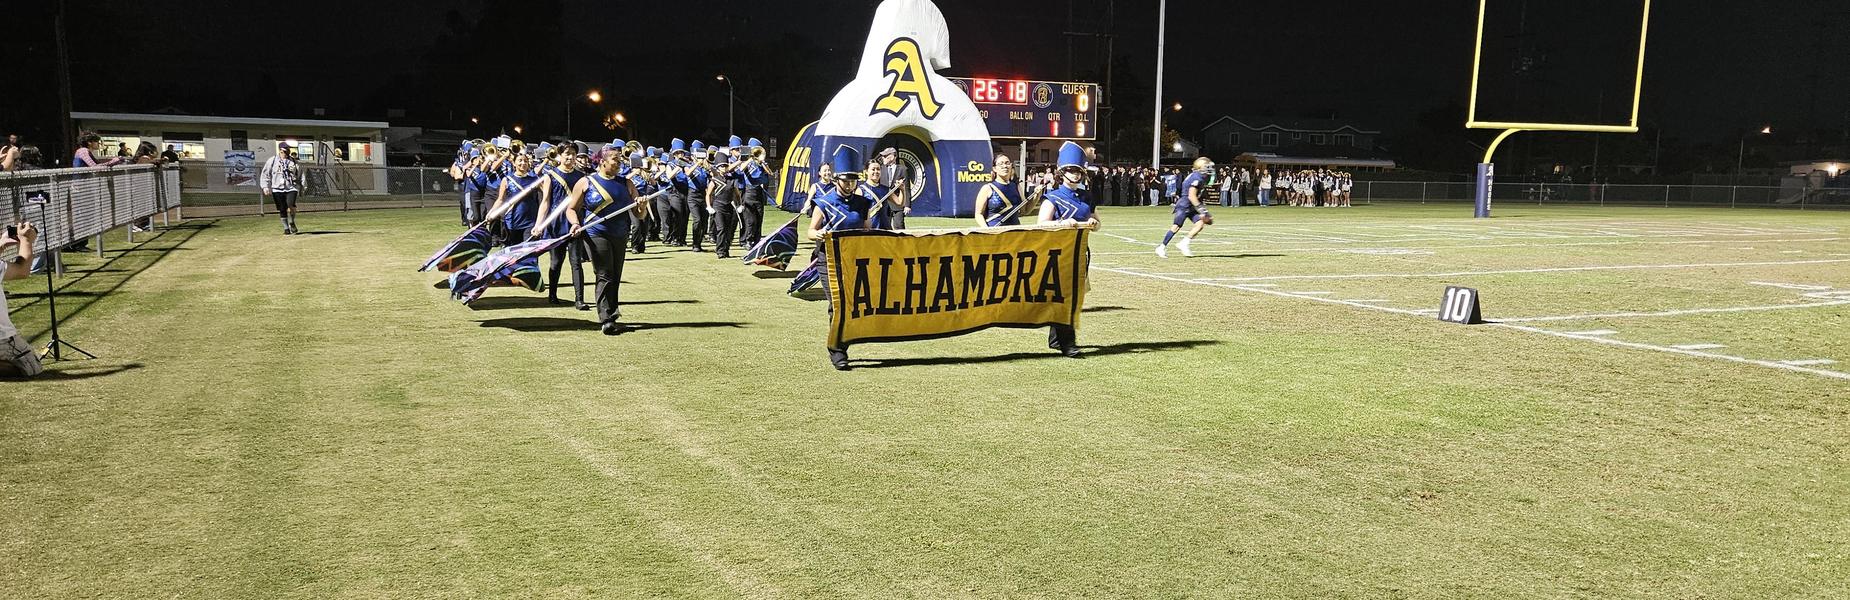
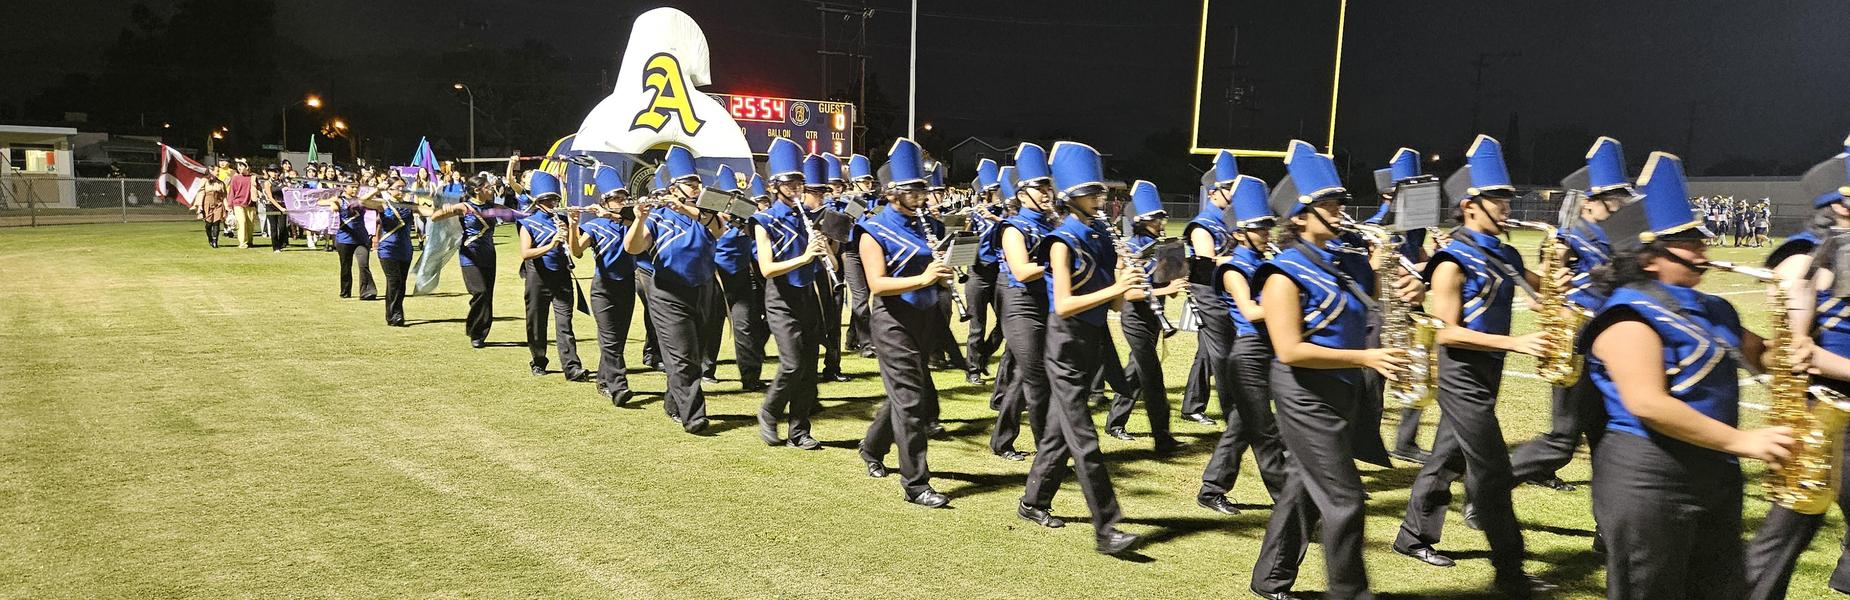
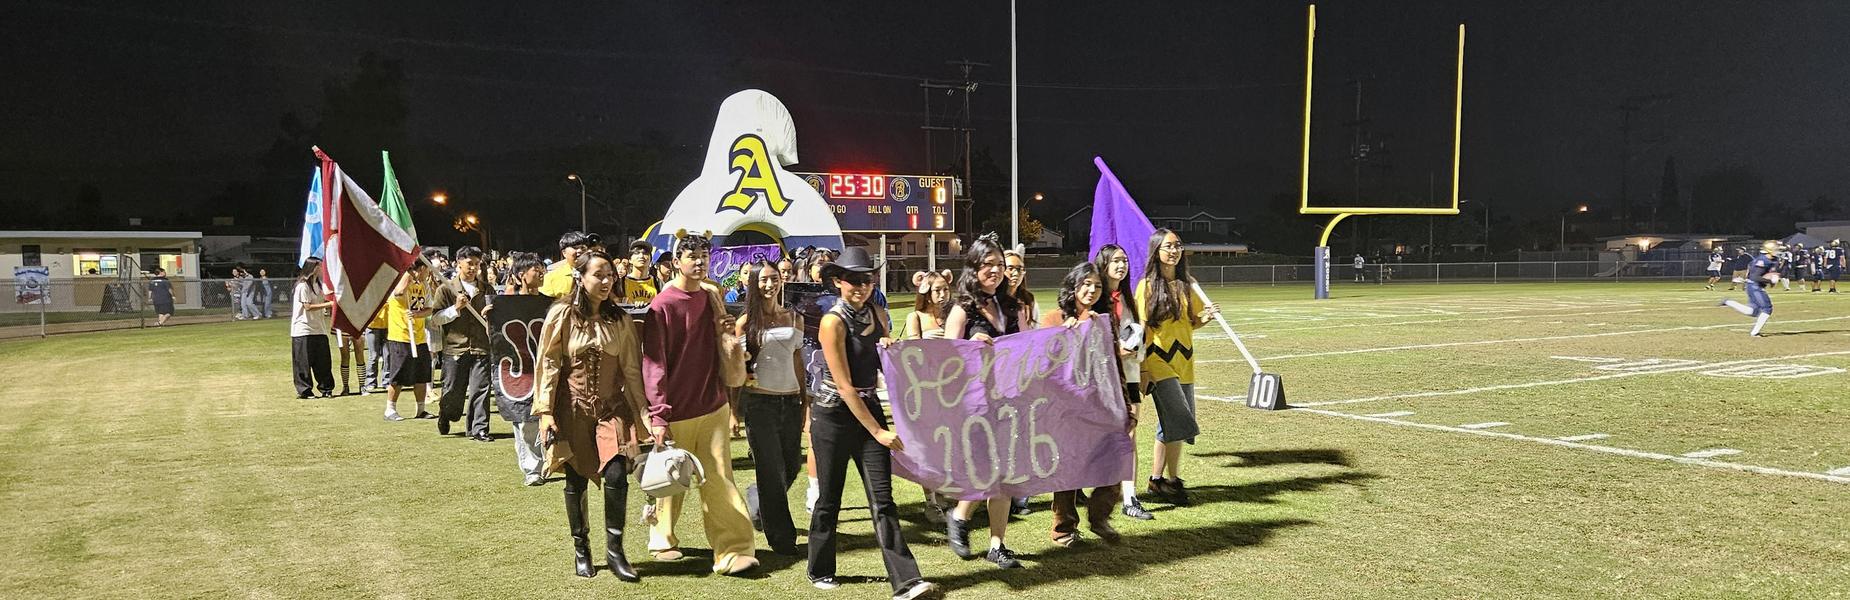
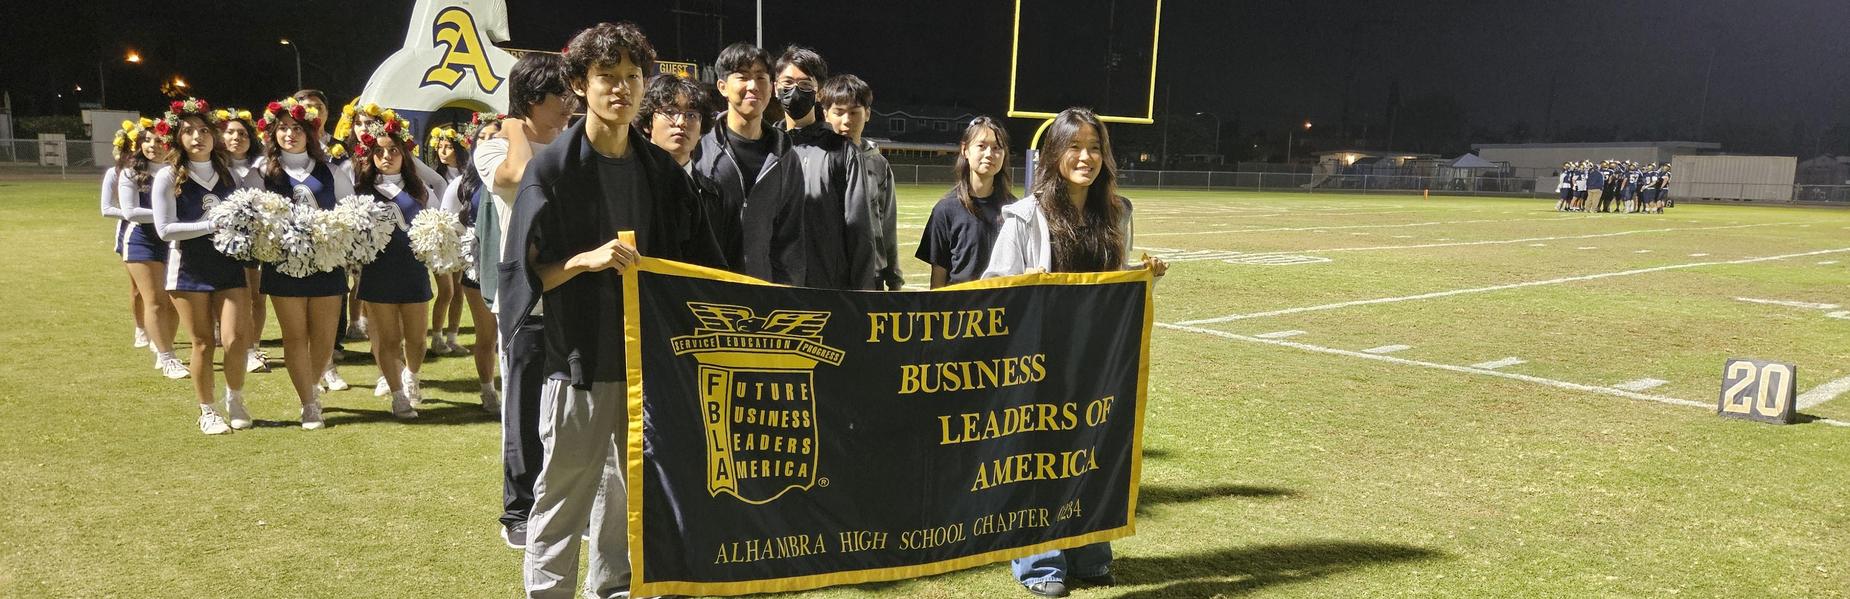
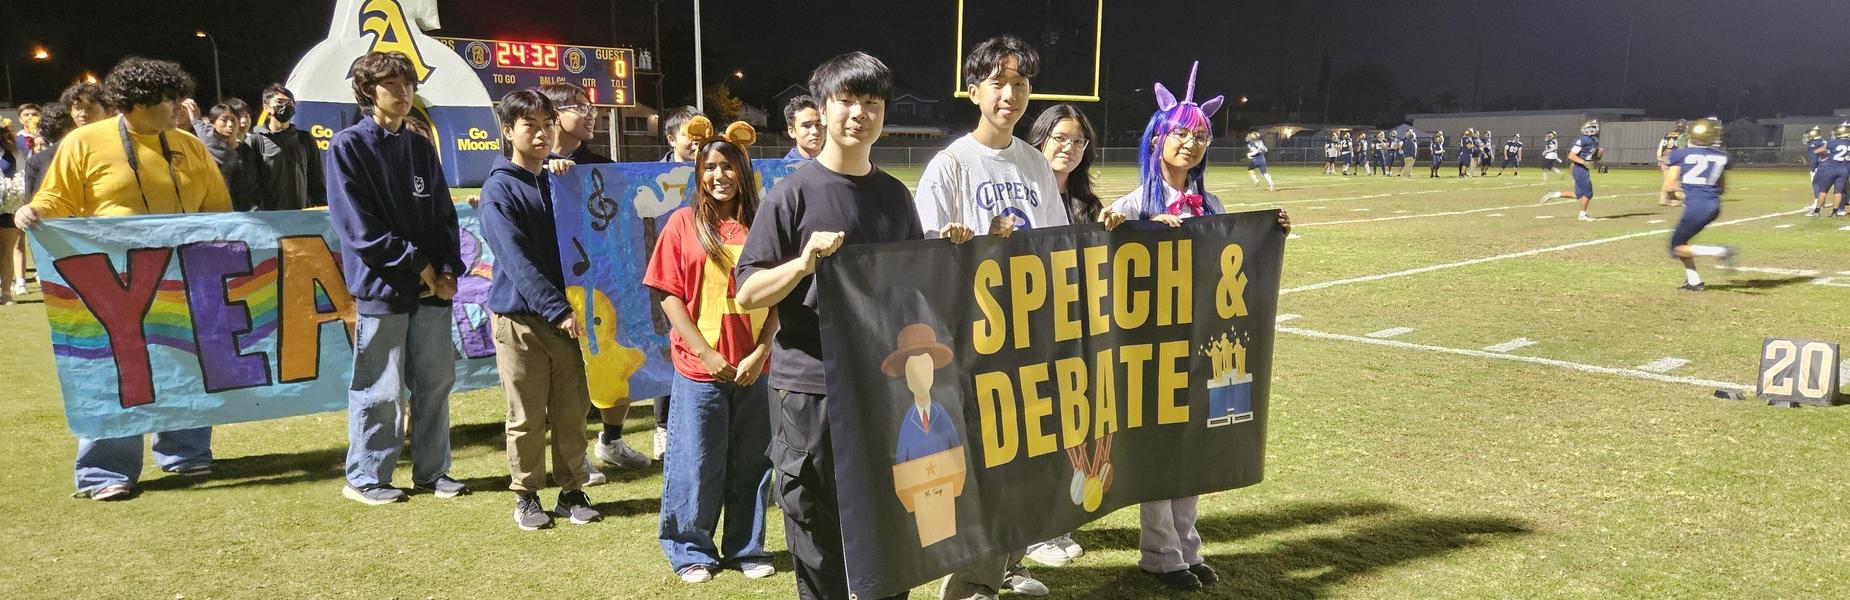
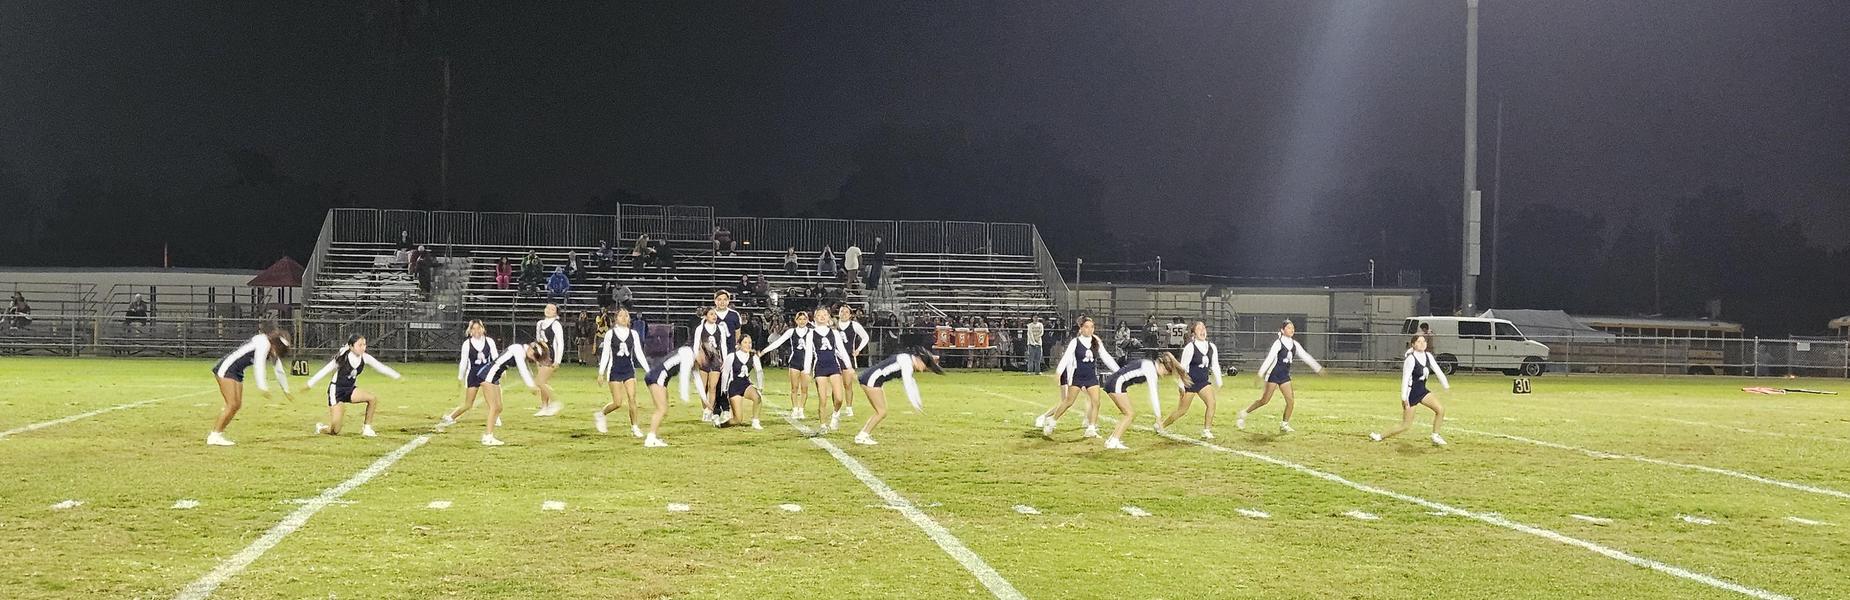
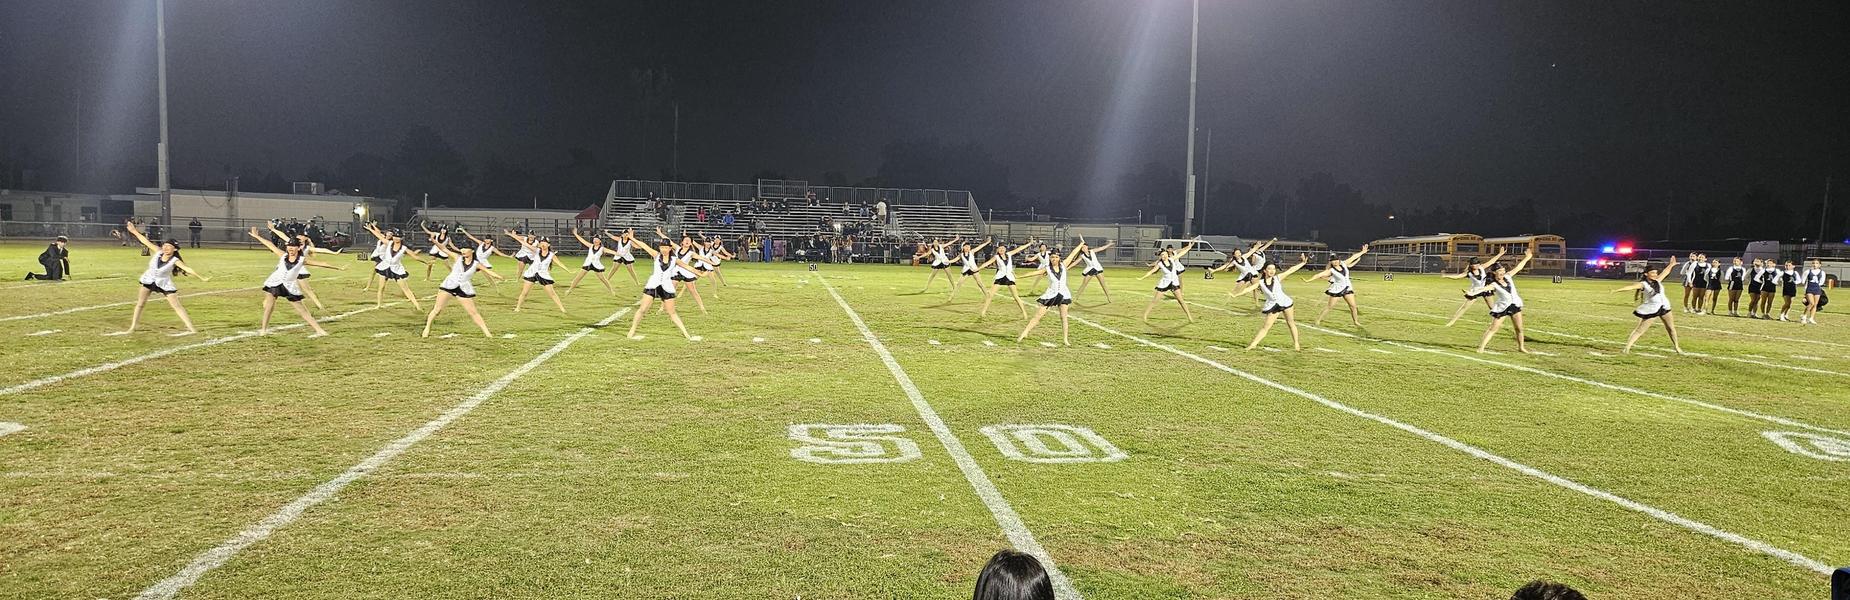
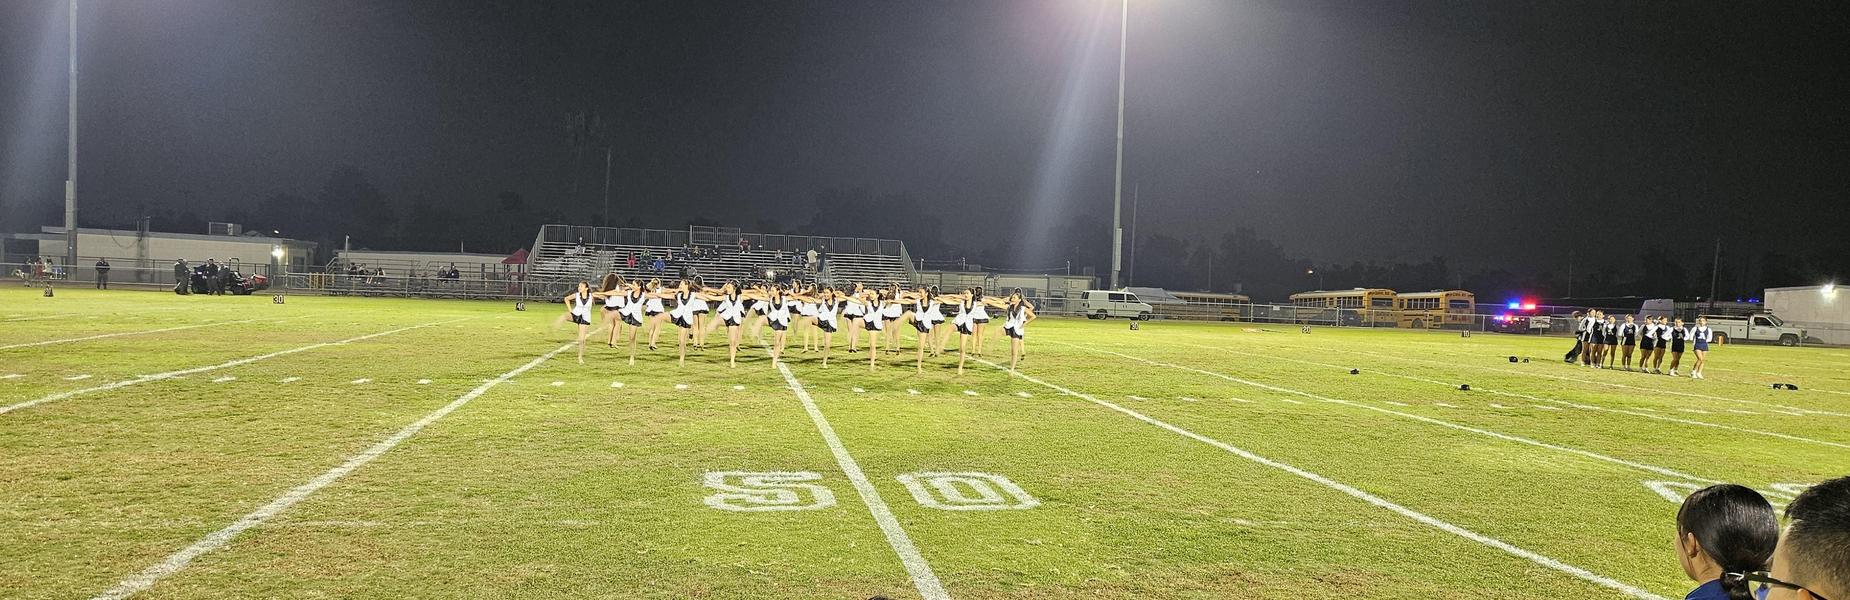
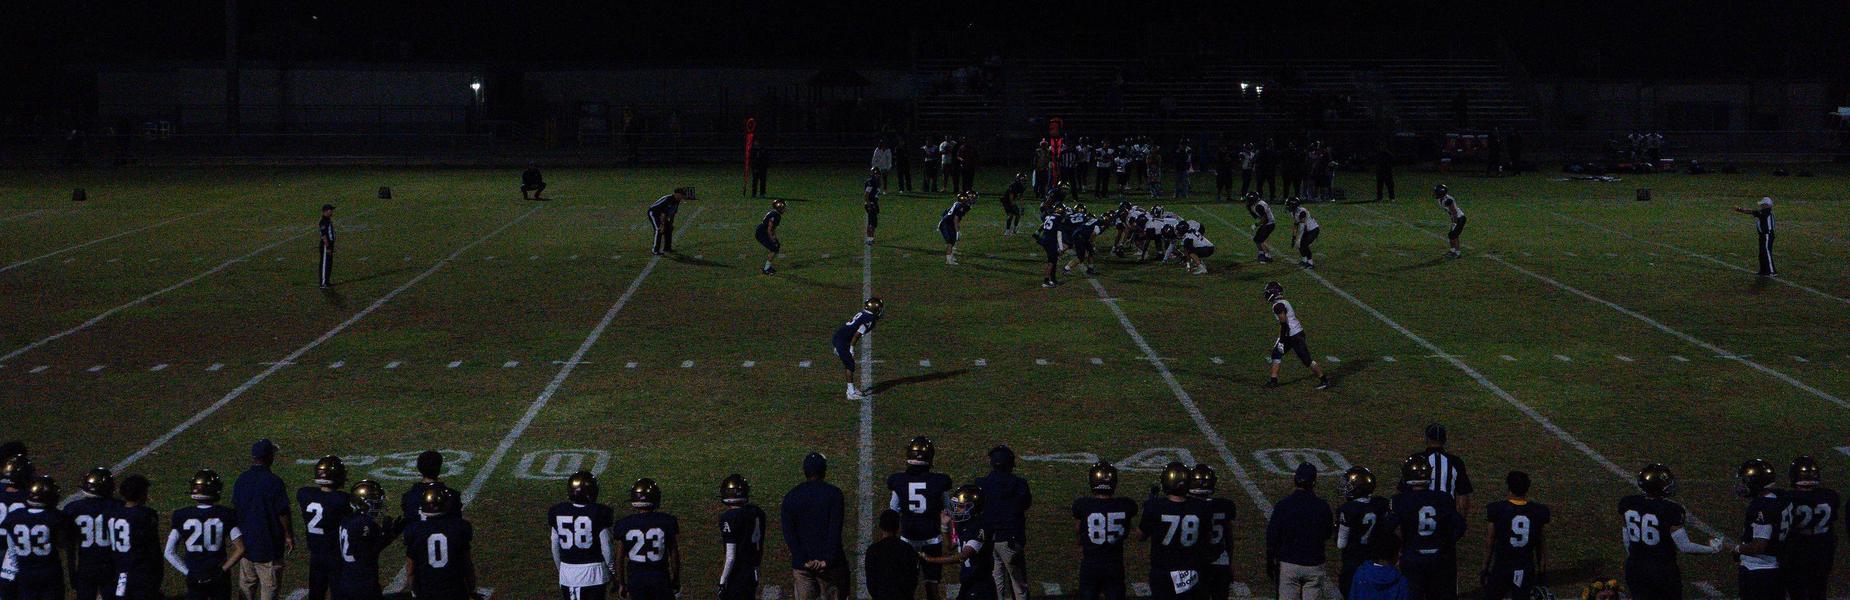
Photo courtesy of Jacob Rojas
Photo courtesy of Jacob Rojas

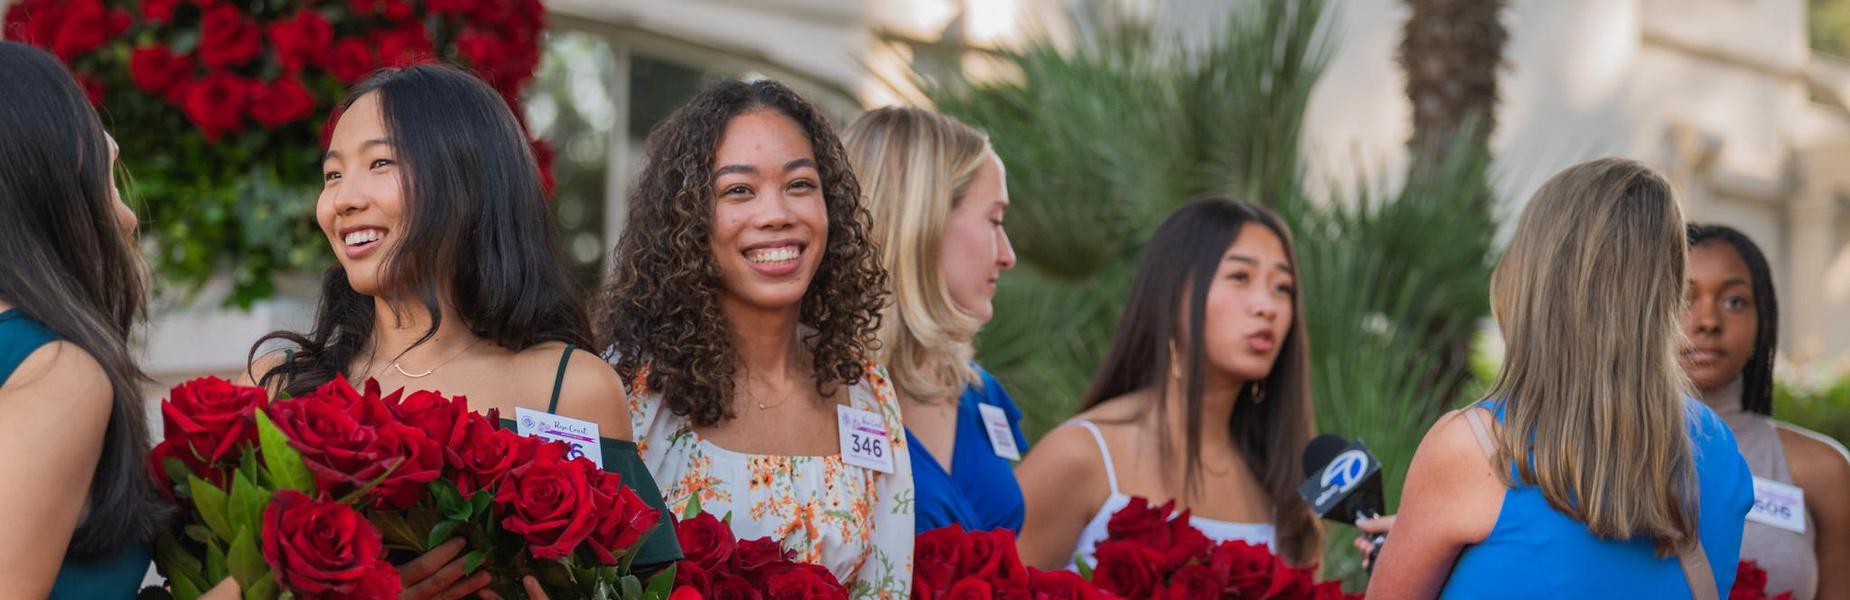
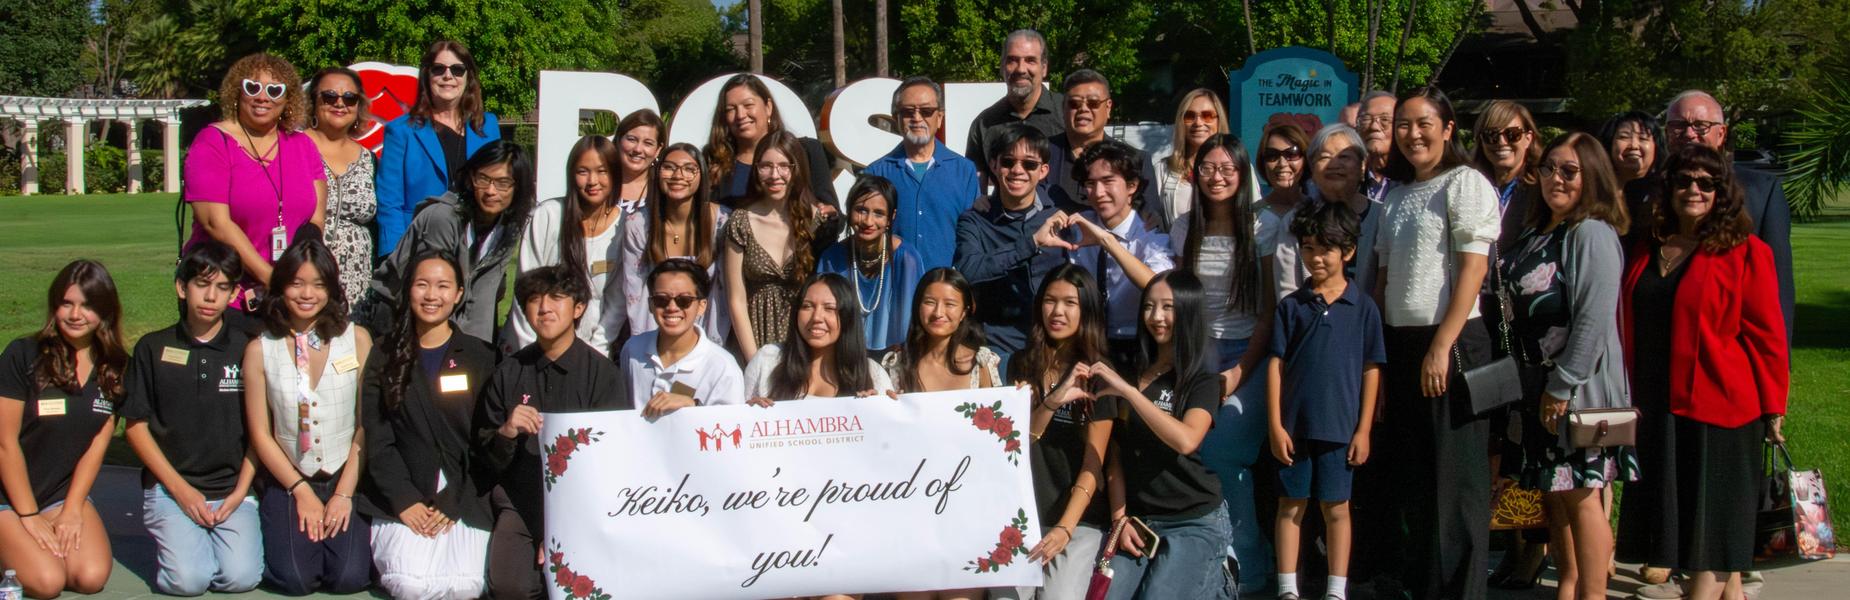
Congratulations to Keiko Rakin for being selected on the Tournament of Roses Court!
Girls Tennis Senior Night
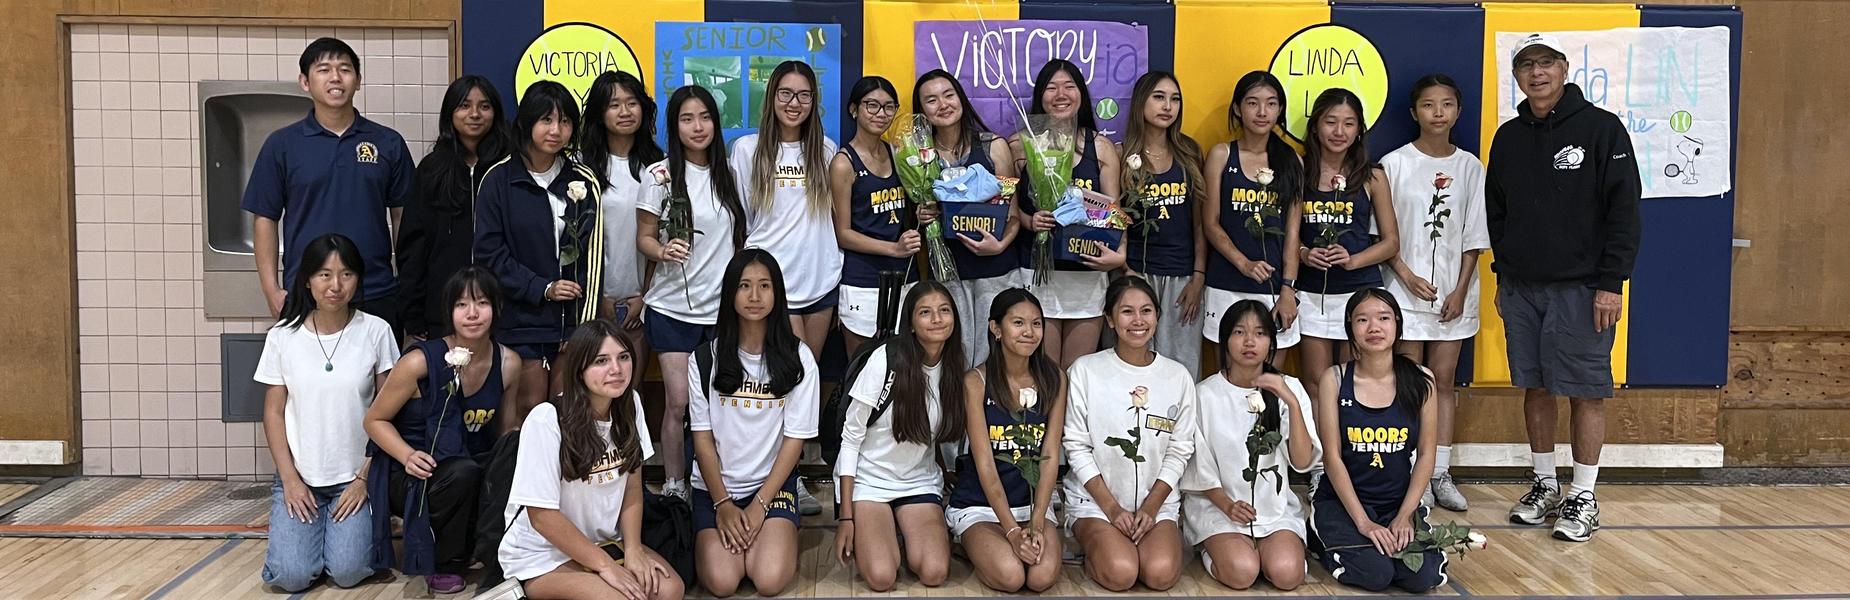
Girls Tennis Senior Night
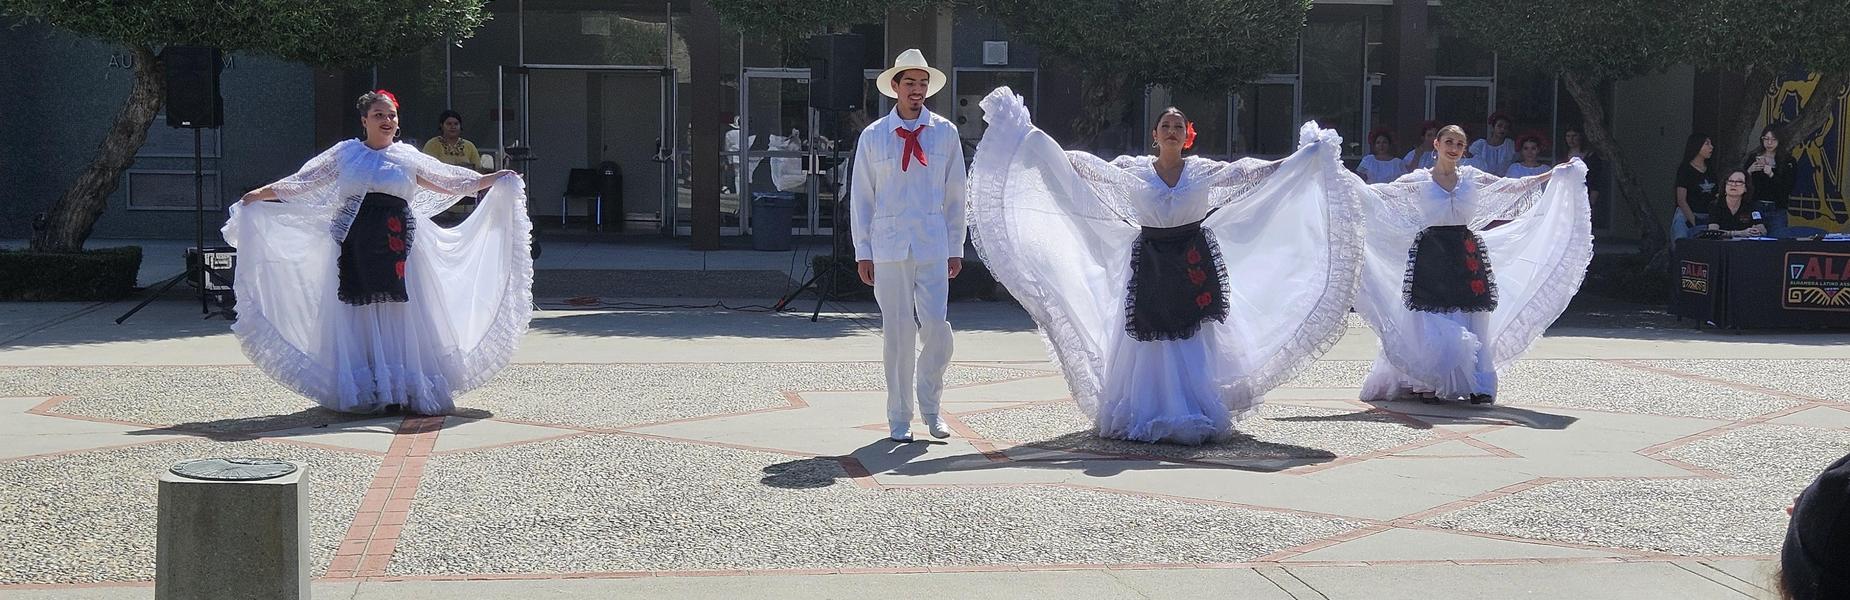
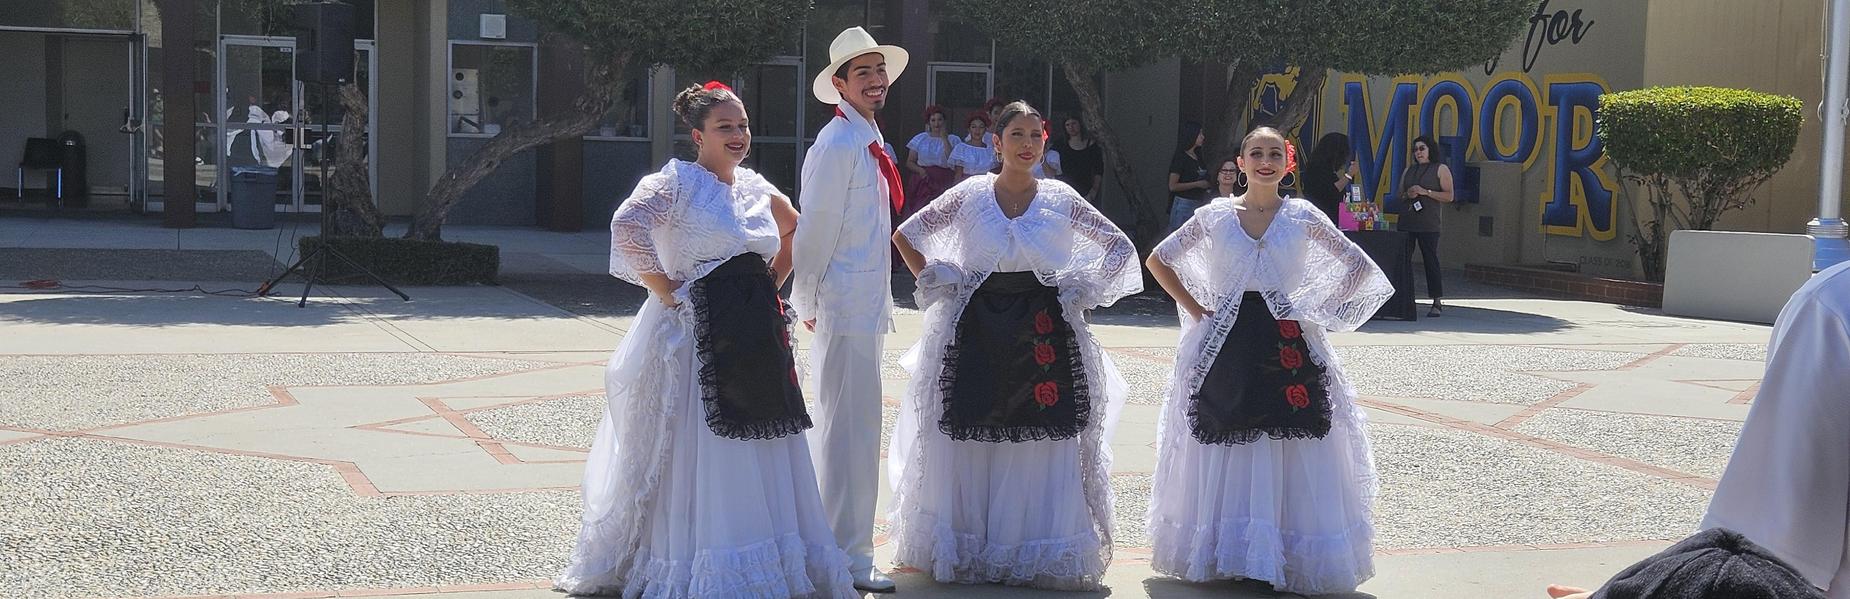
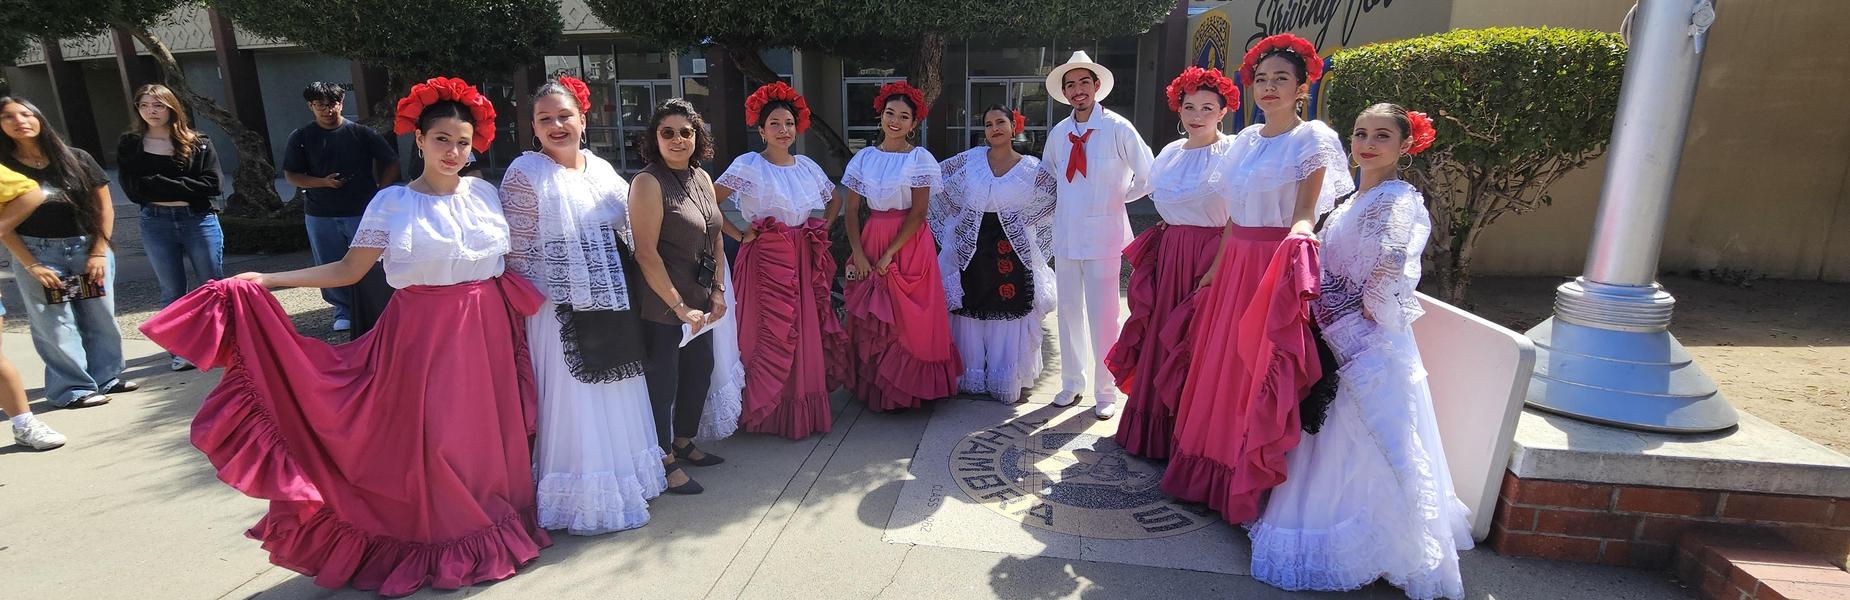
Folklorico performance during Hispanic Heritage Week Celebration (photo courtesy of Mr. Jeff Levie)
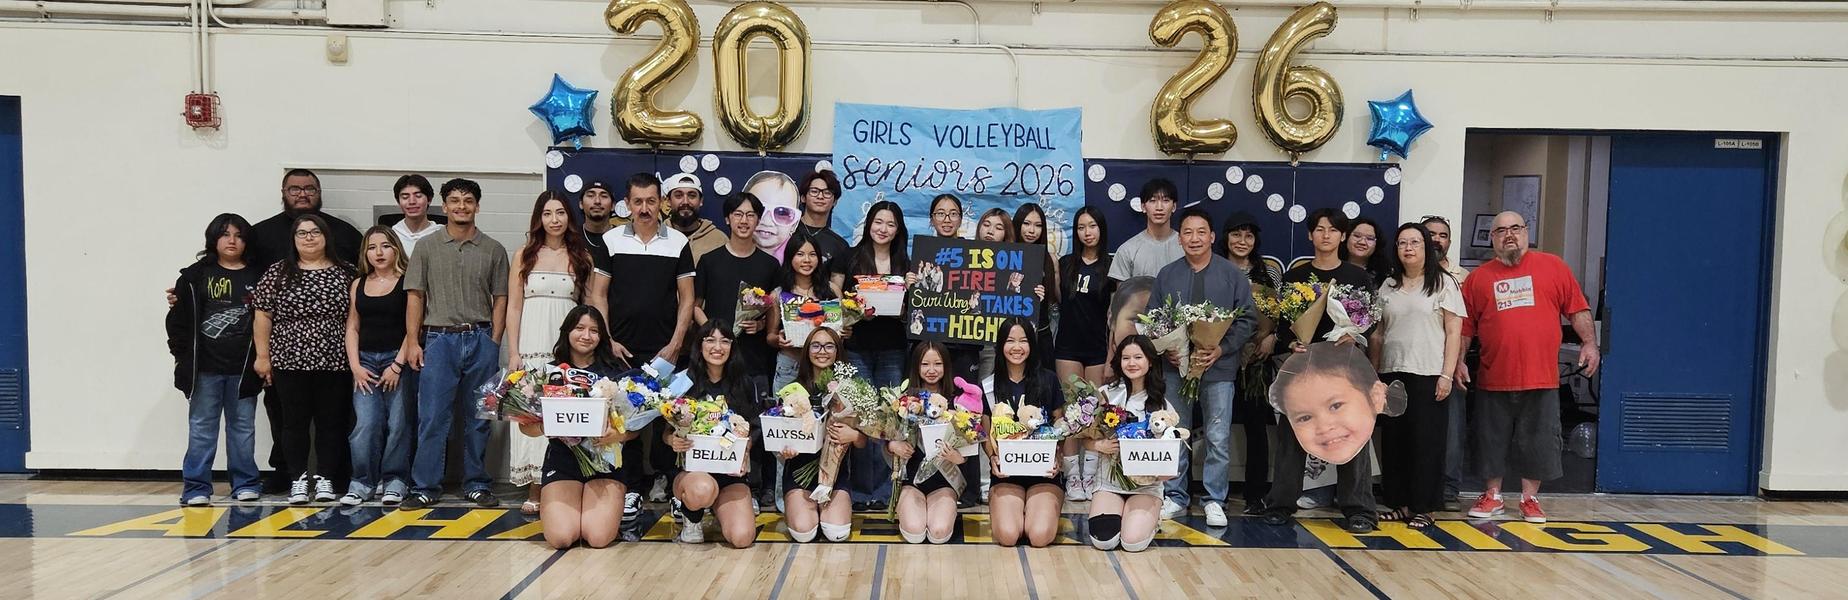
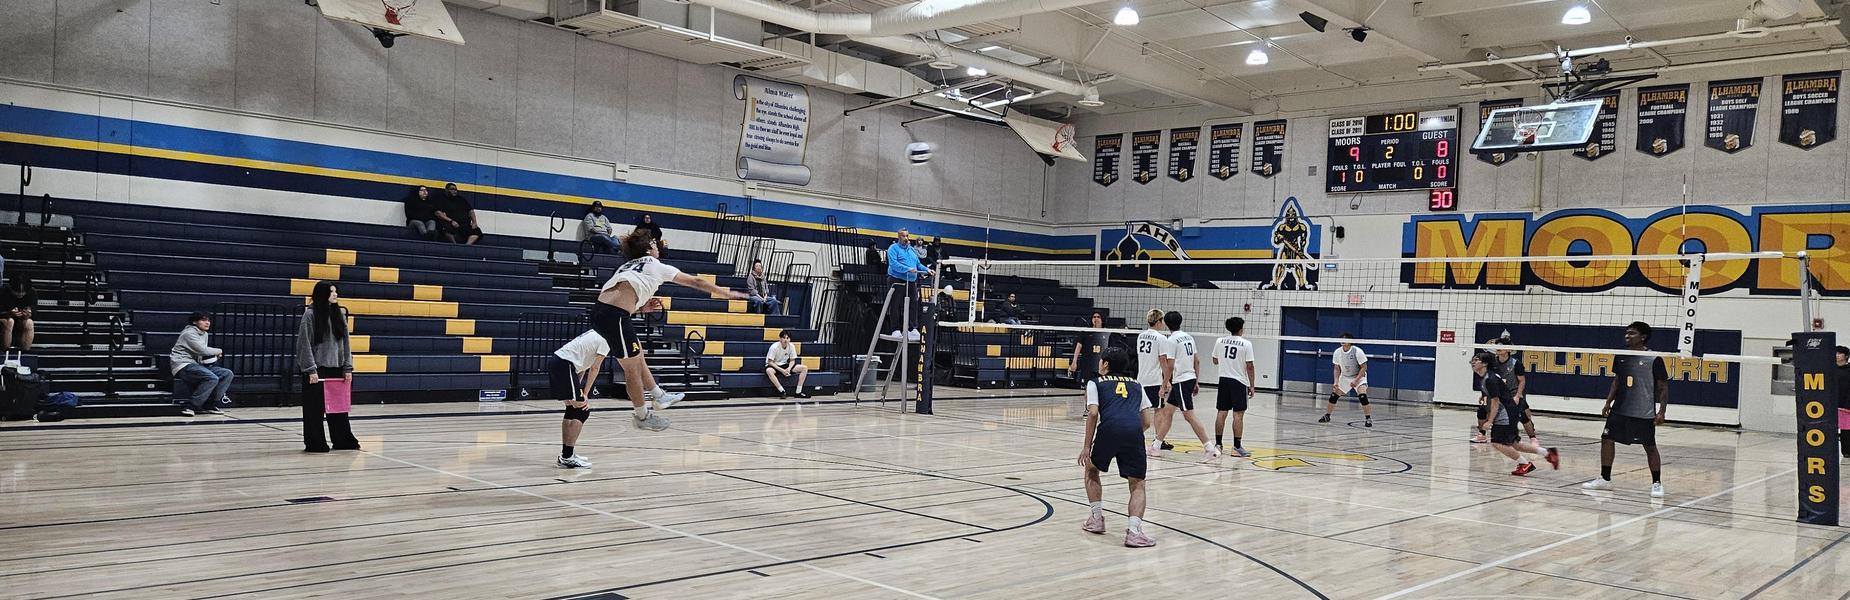
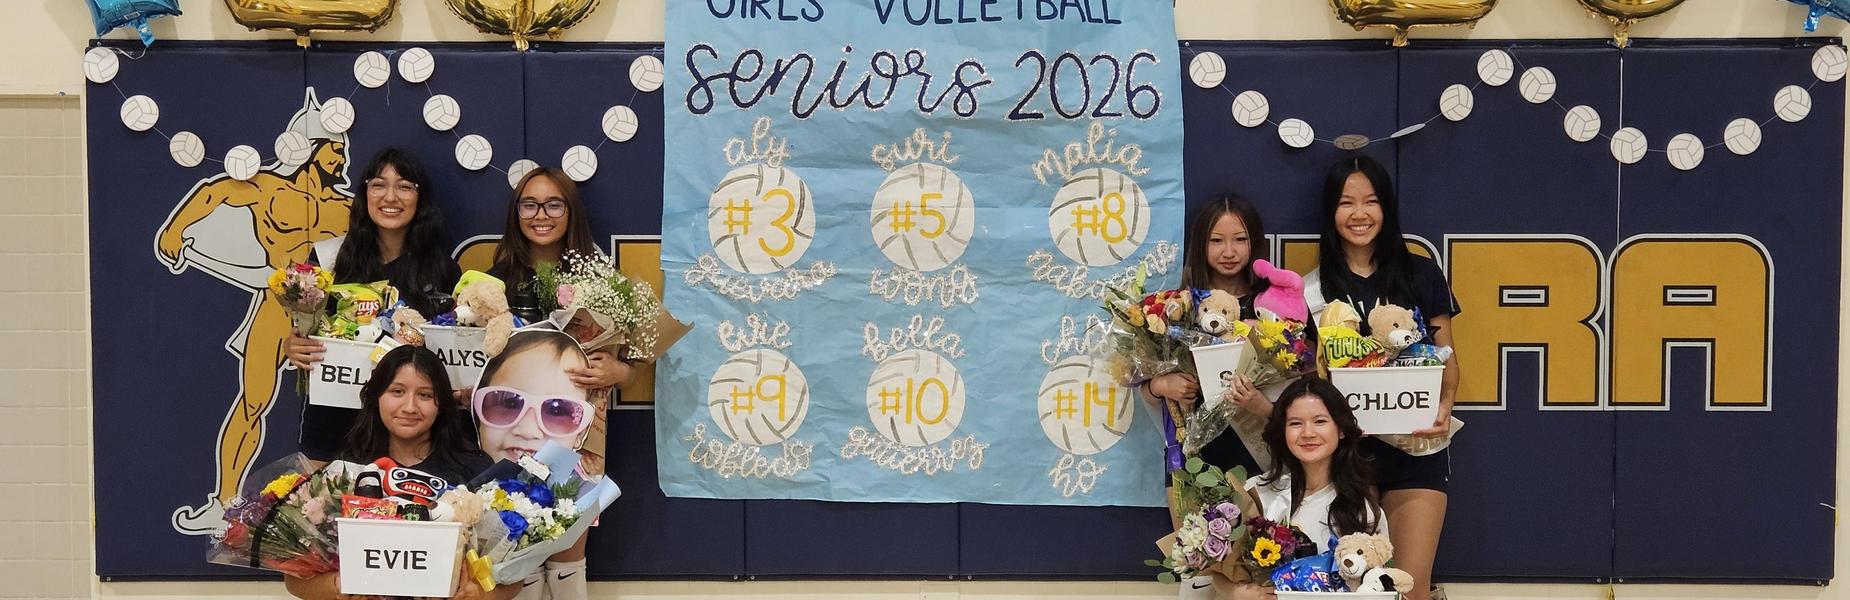
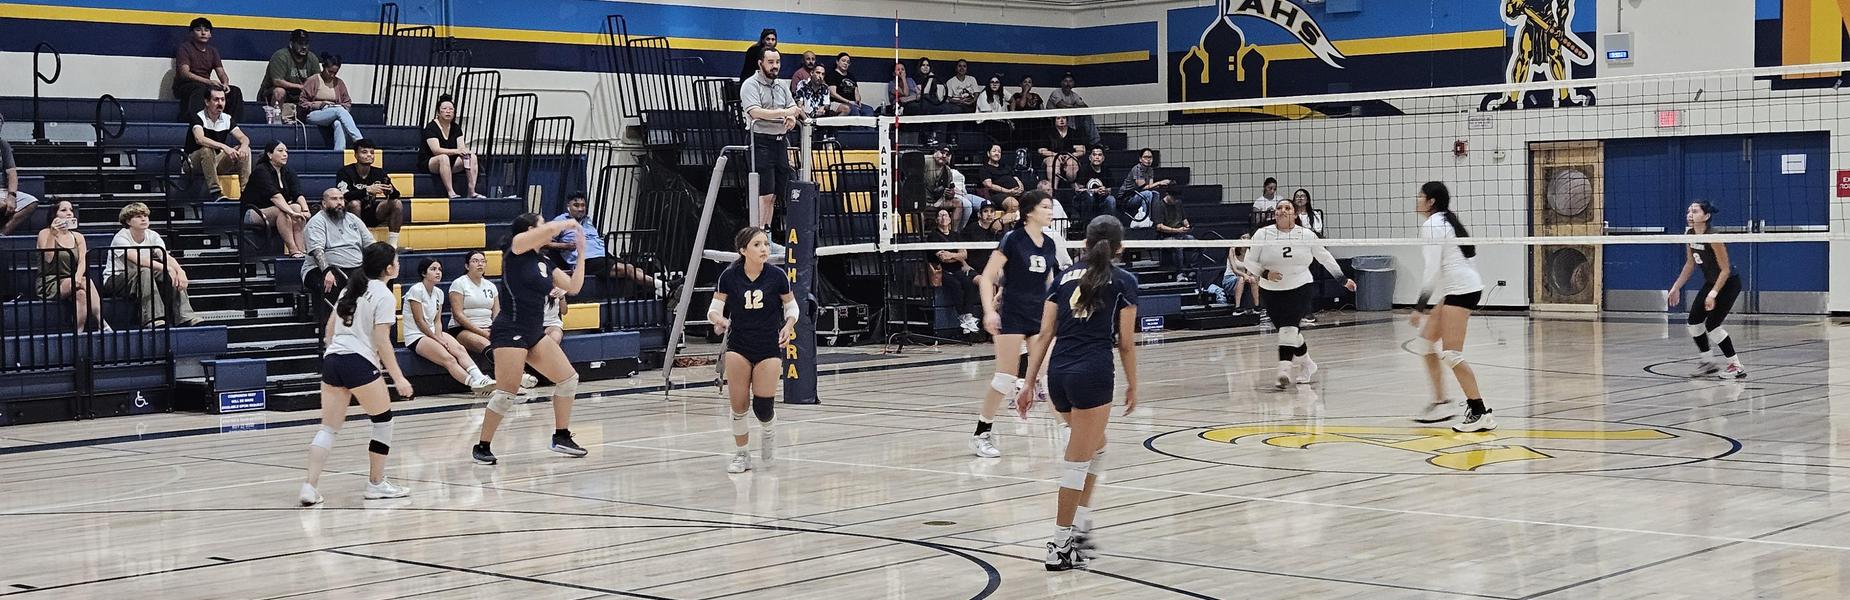
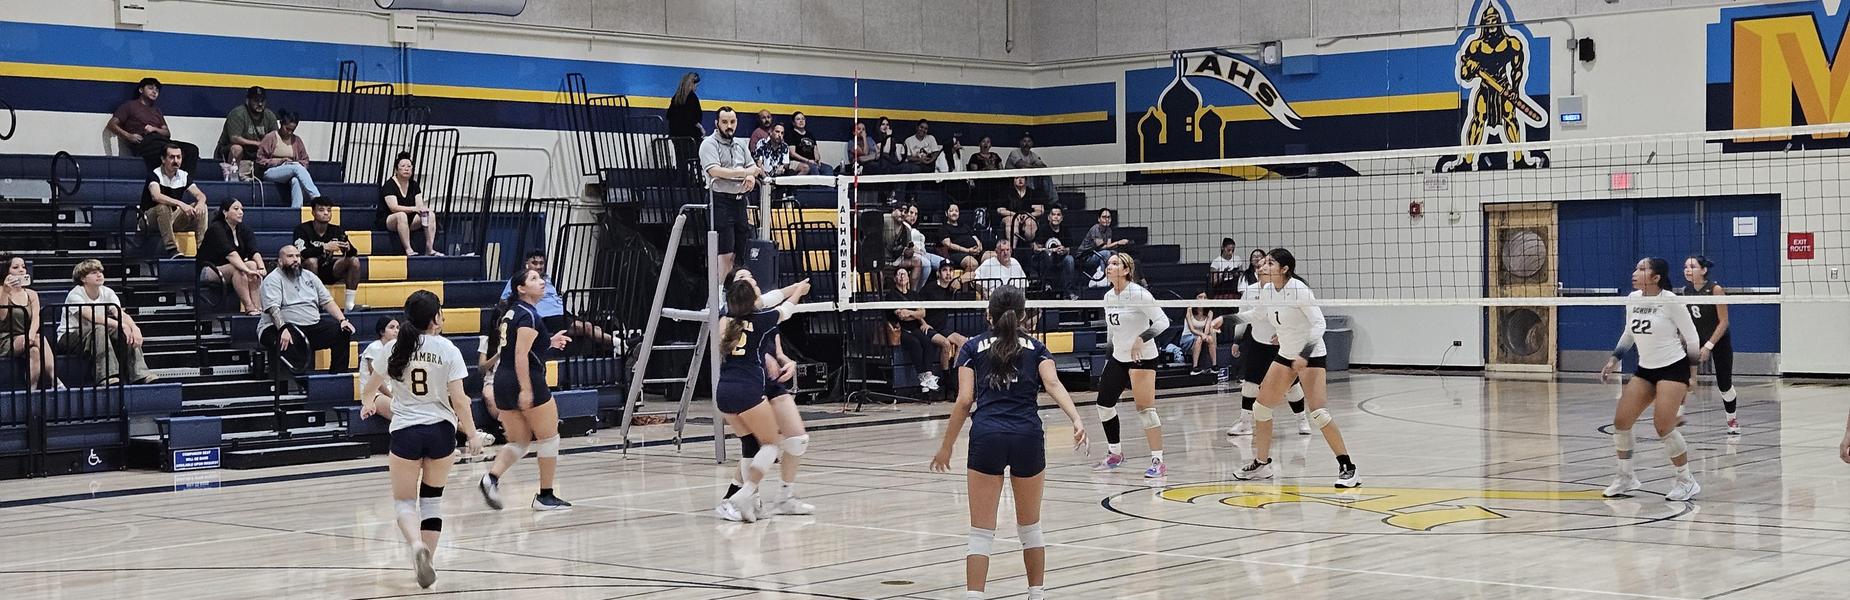
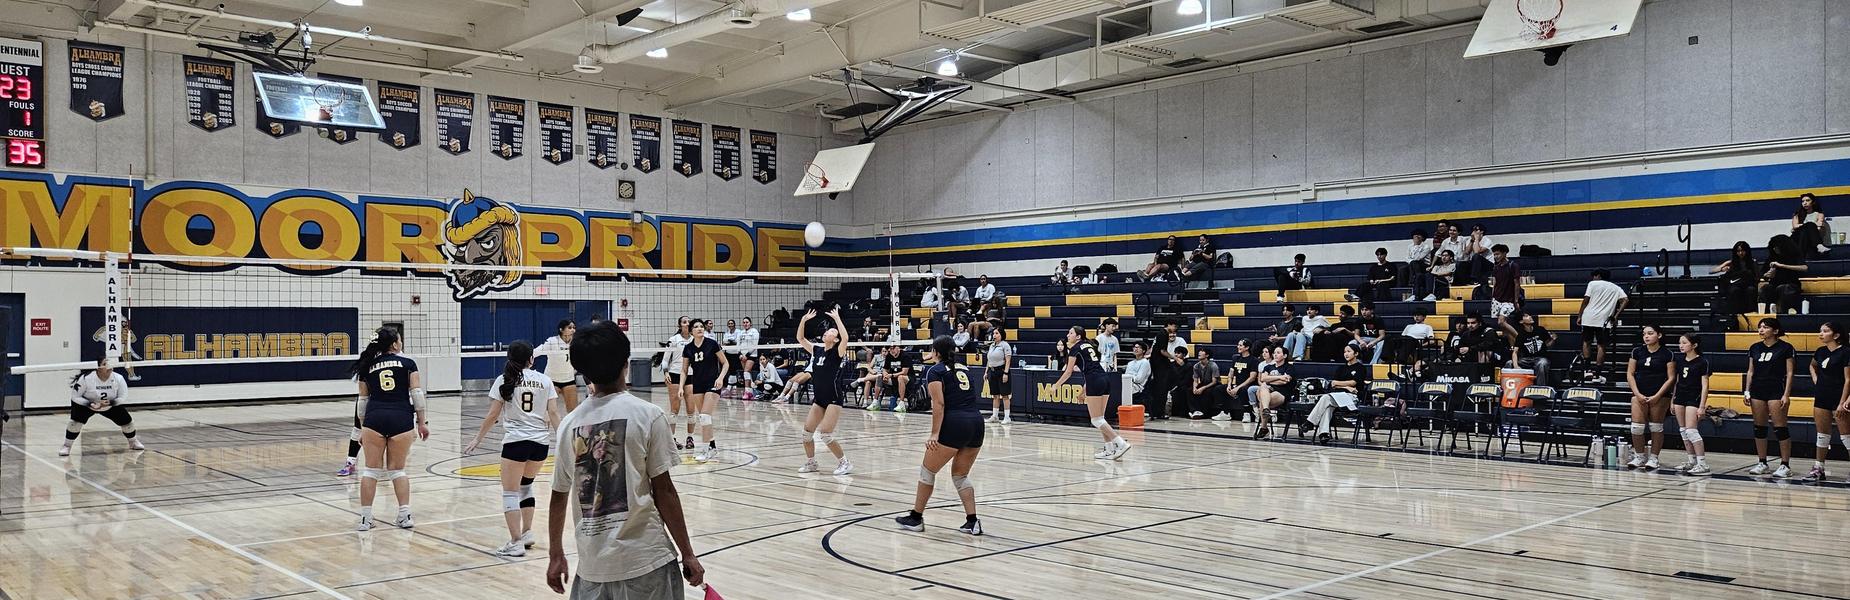
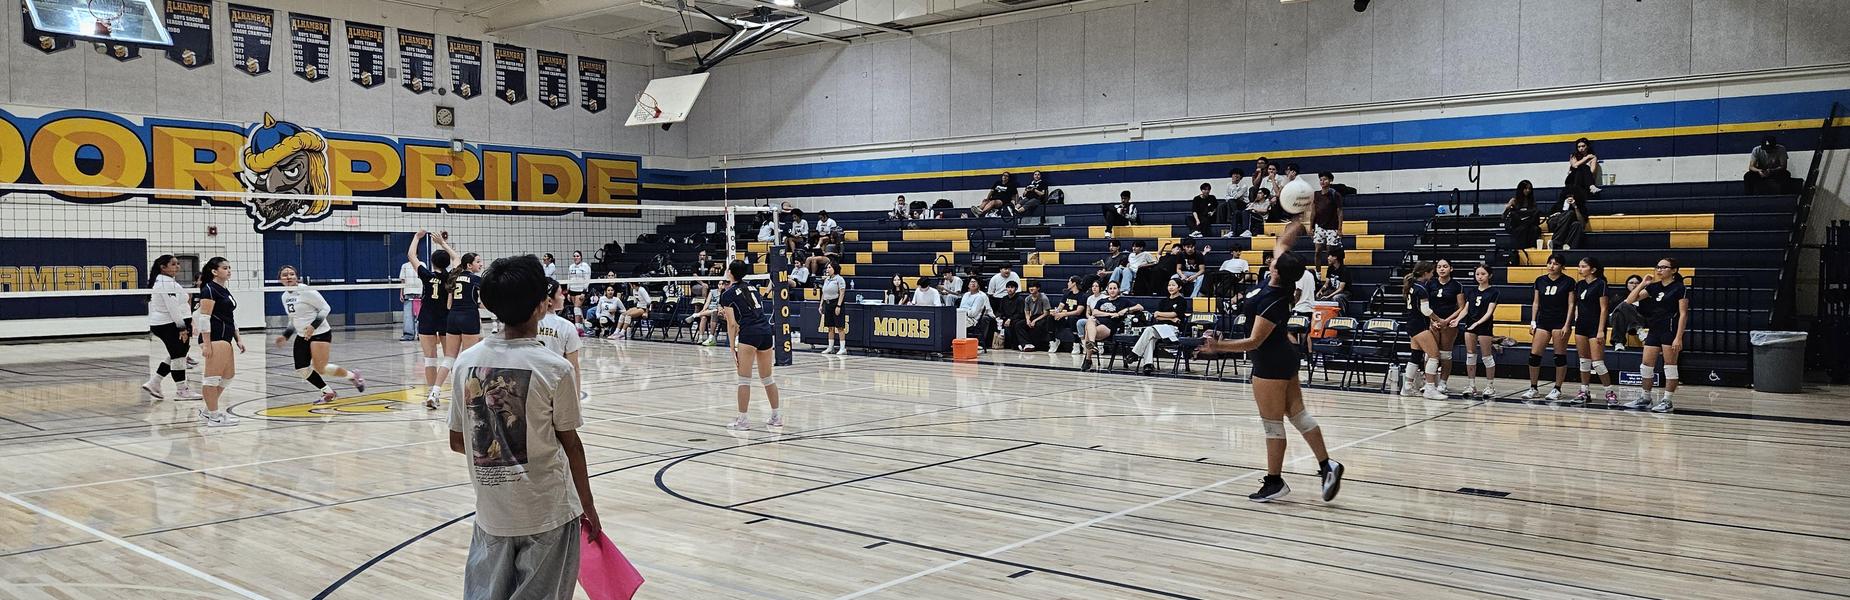
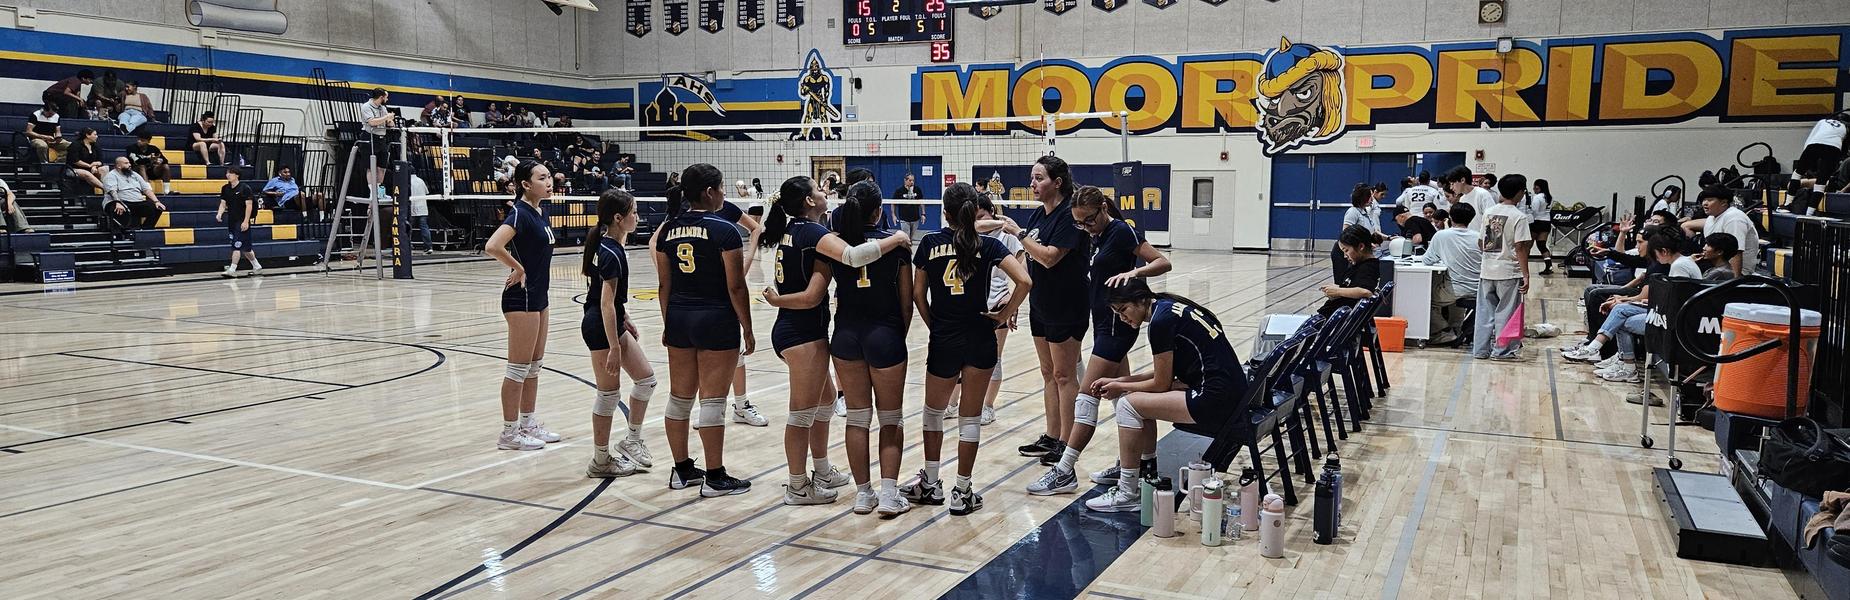
Girls Volleyball Senior Night
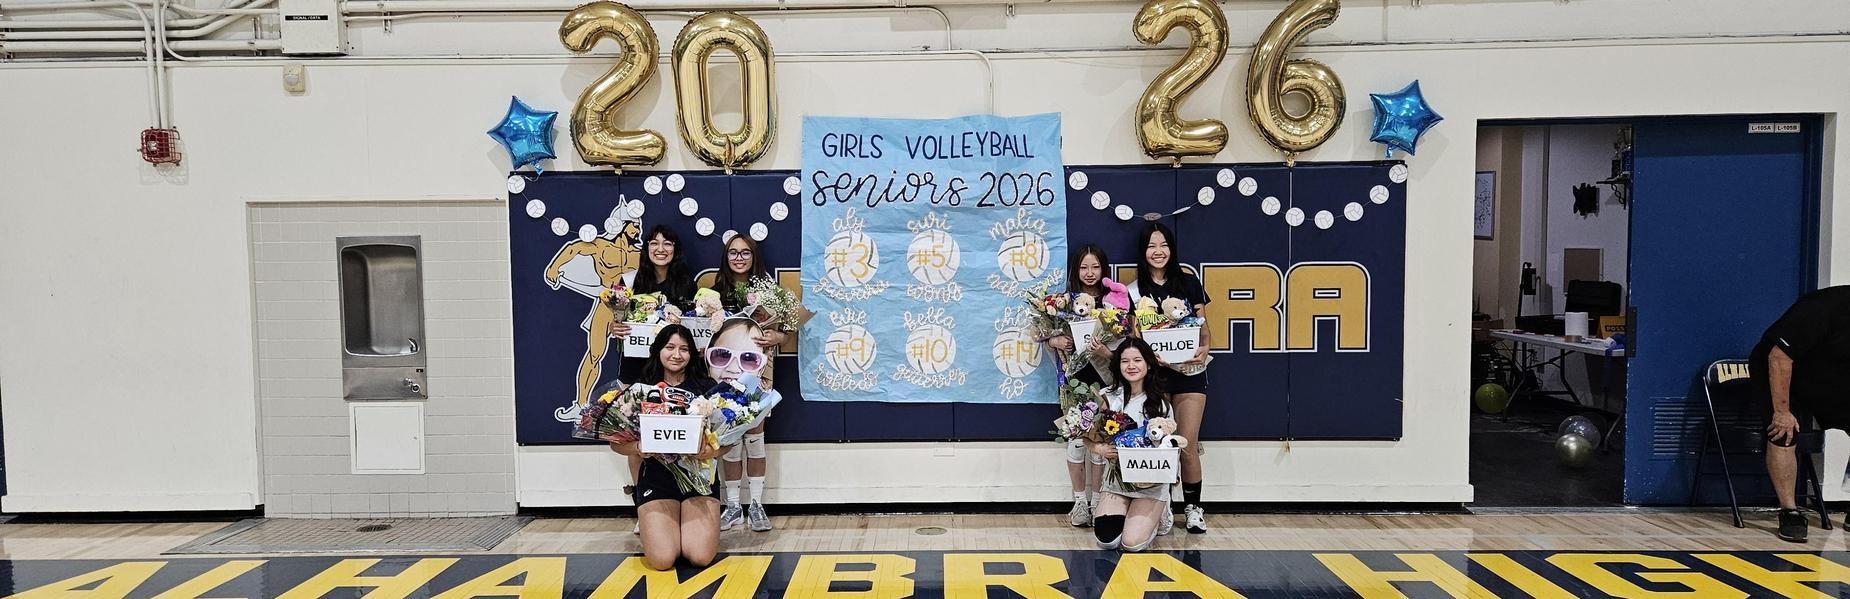
Girls Volleyball Senior Night
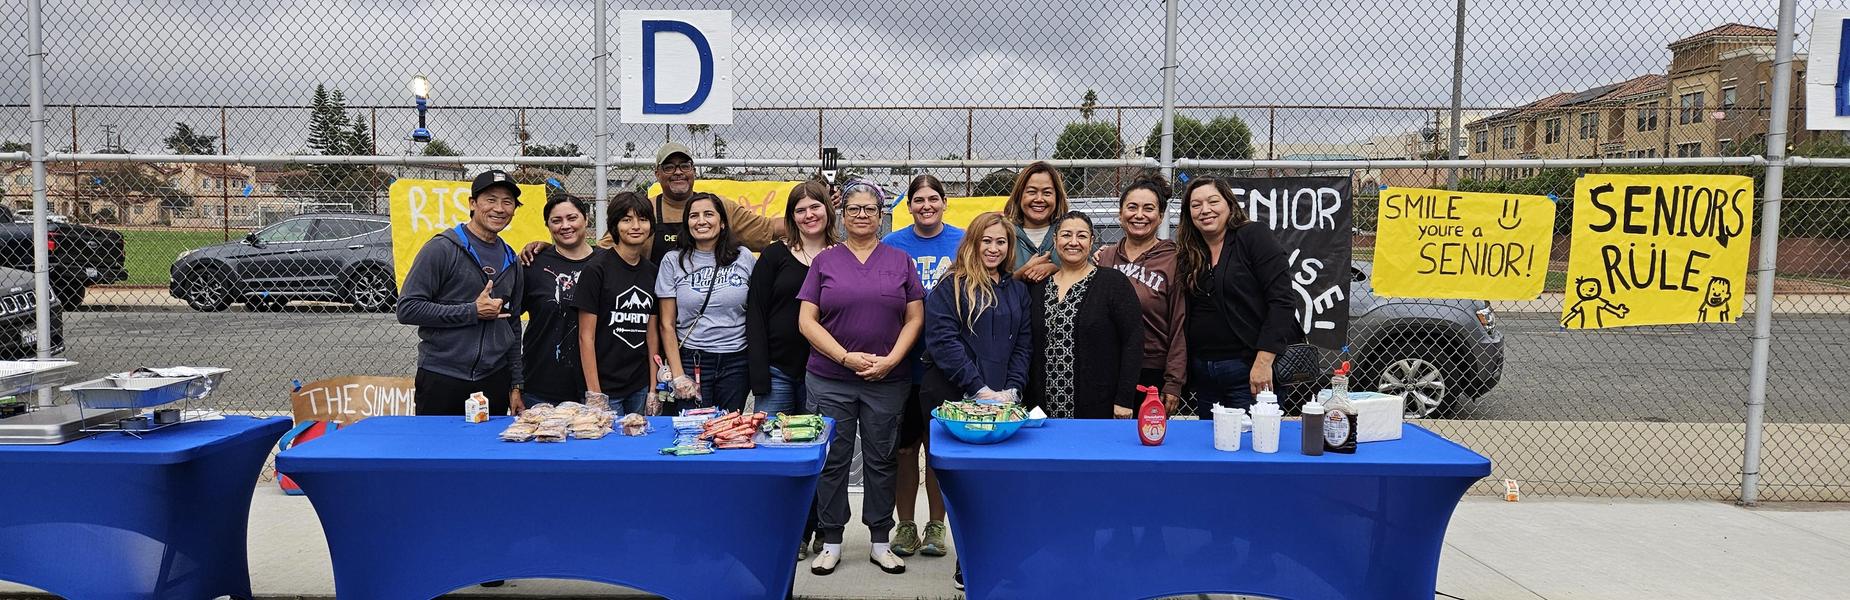
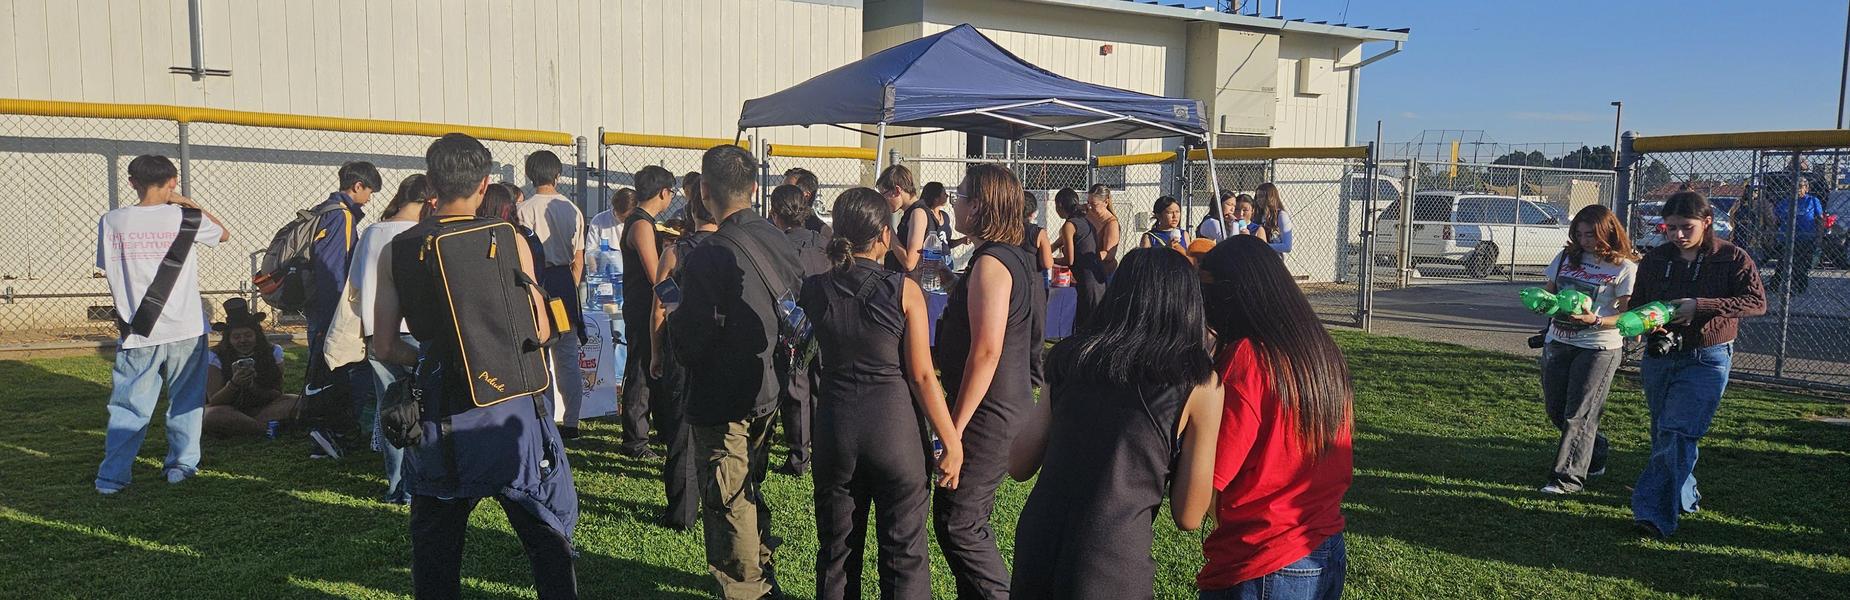
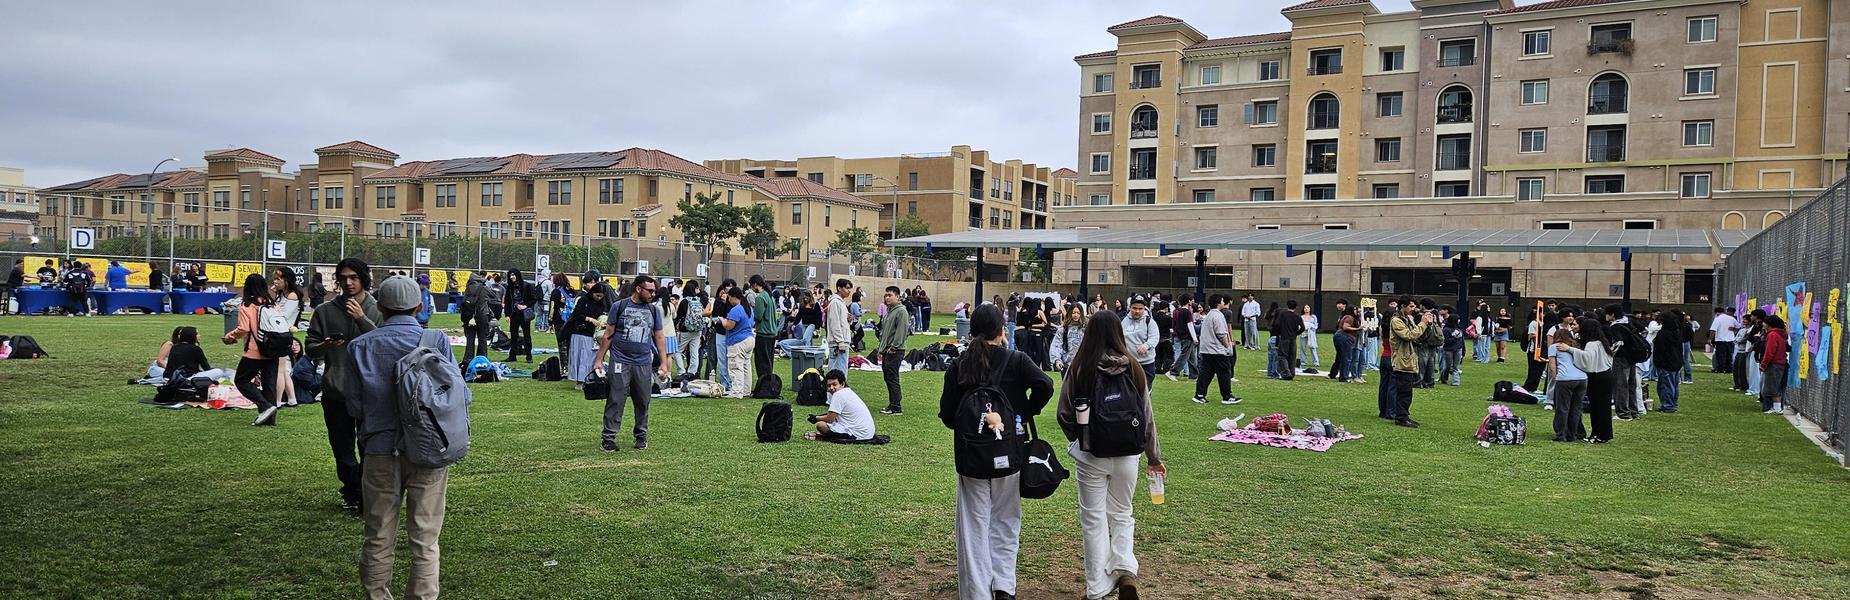
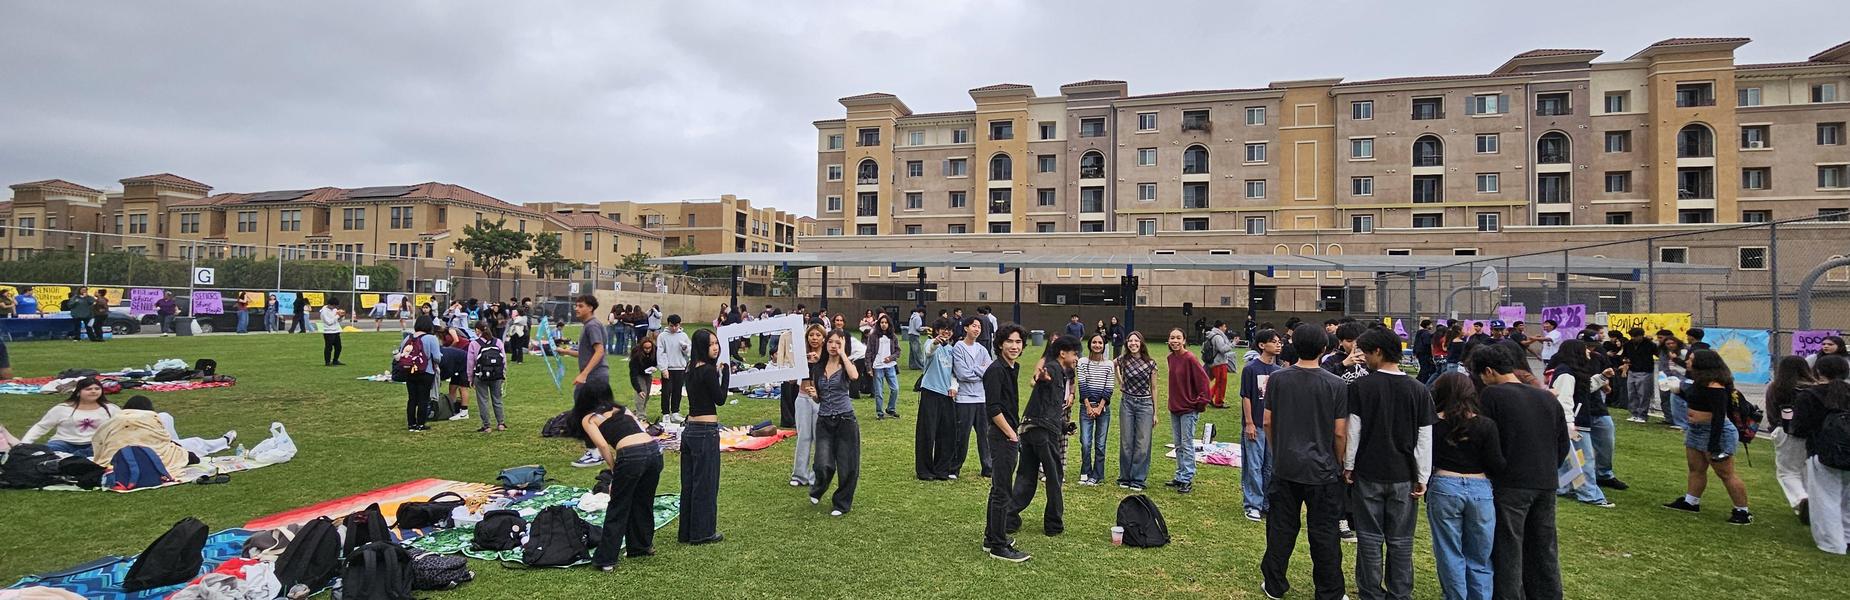
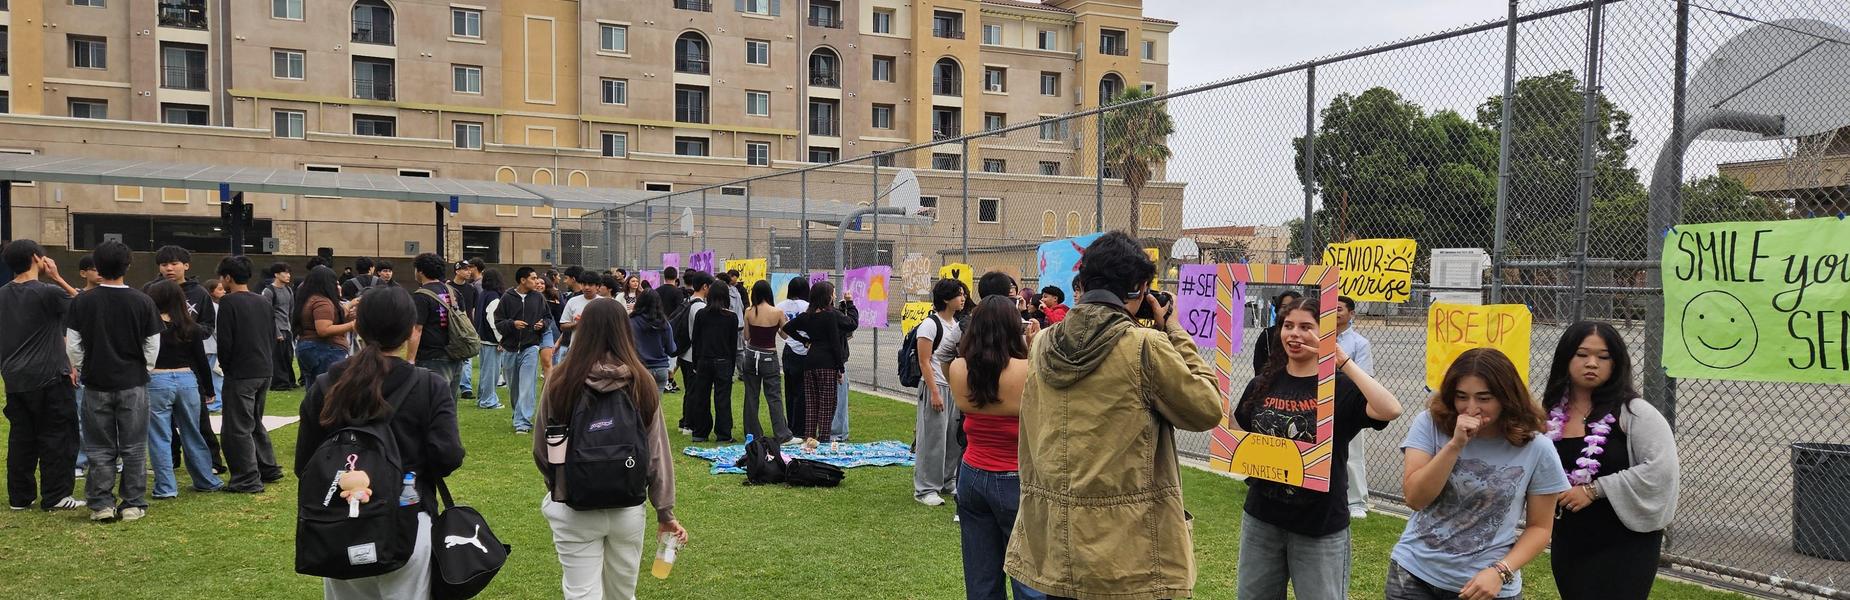
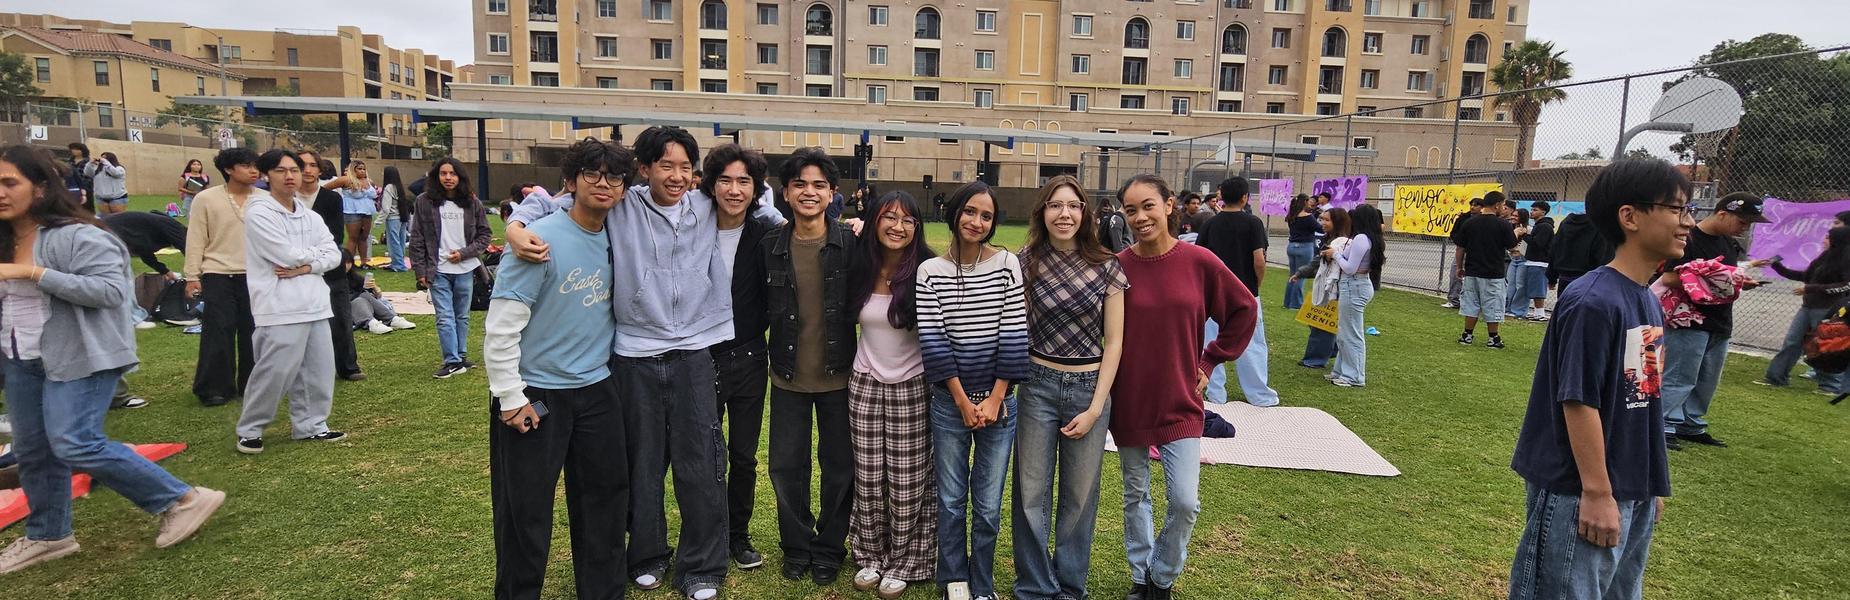
Thank you, PTA, for hosting Senior Sunrise!!!
Club Fair
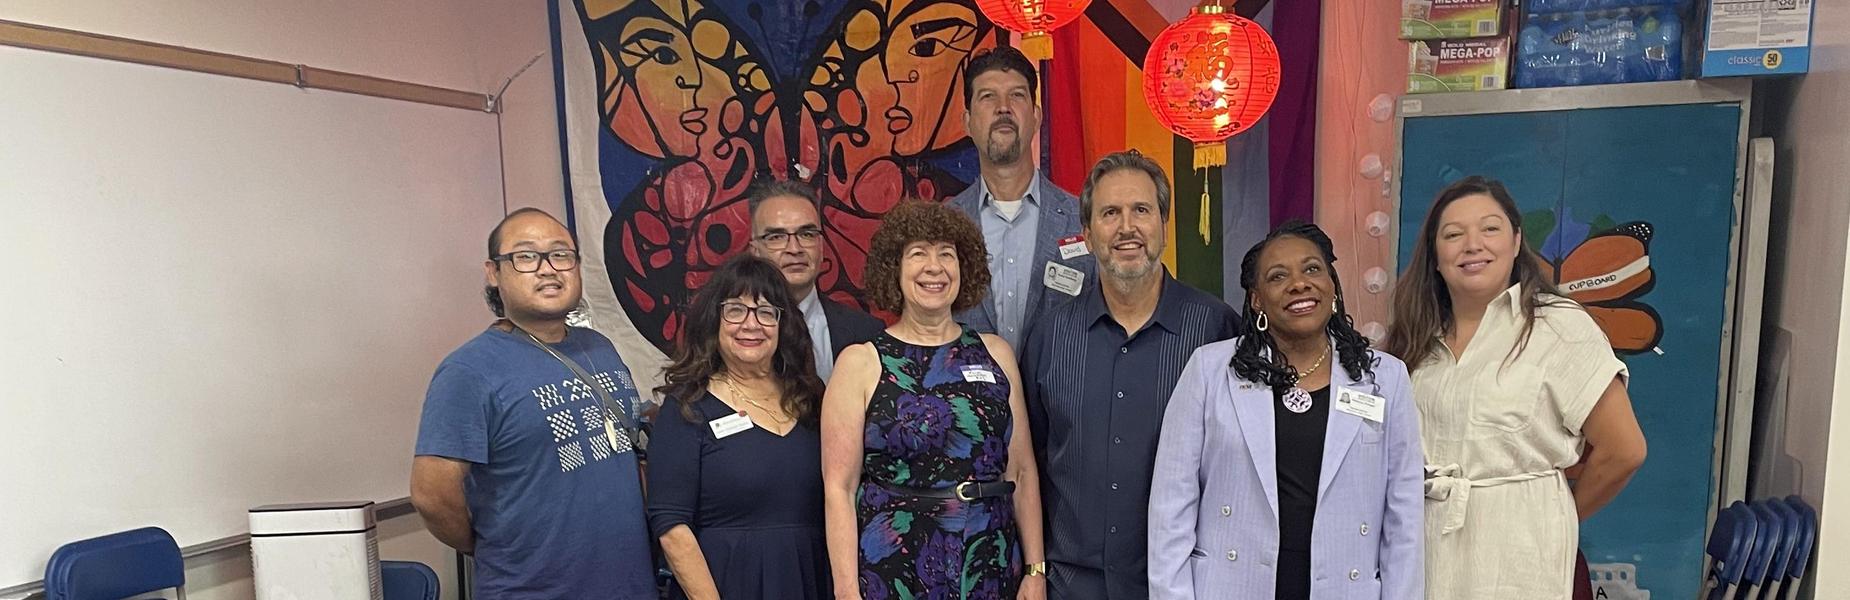
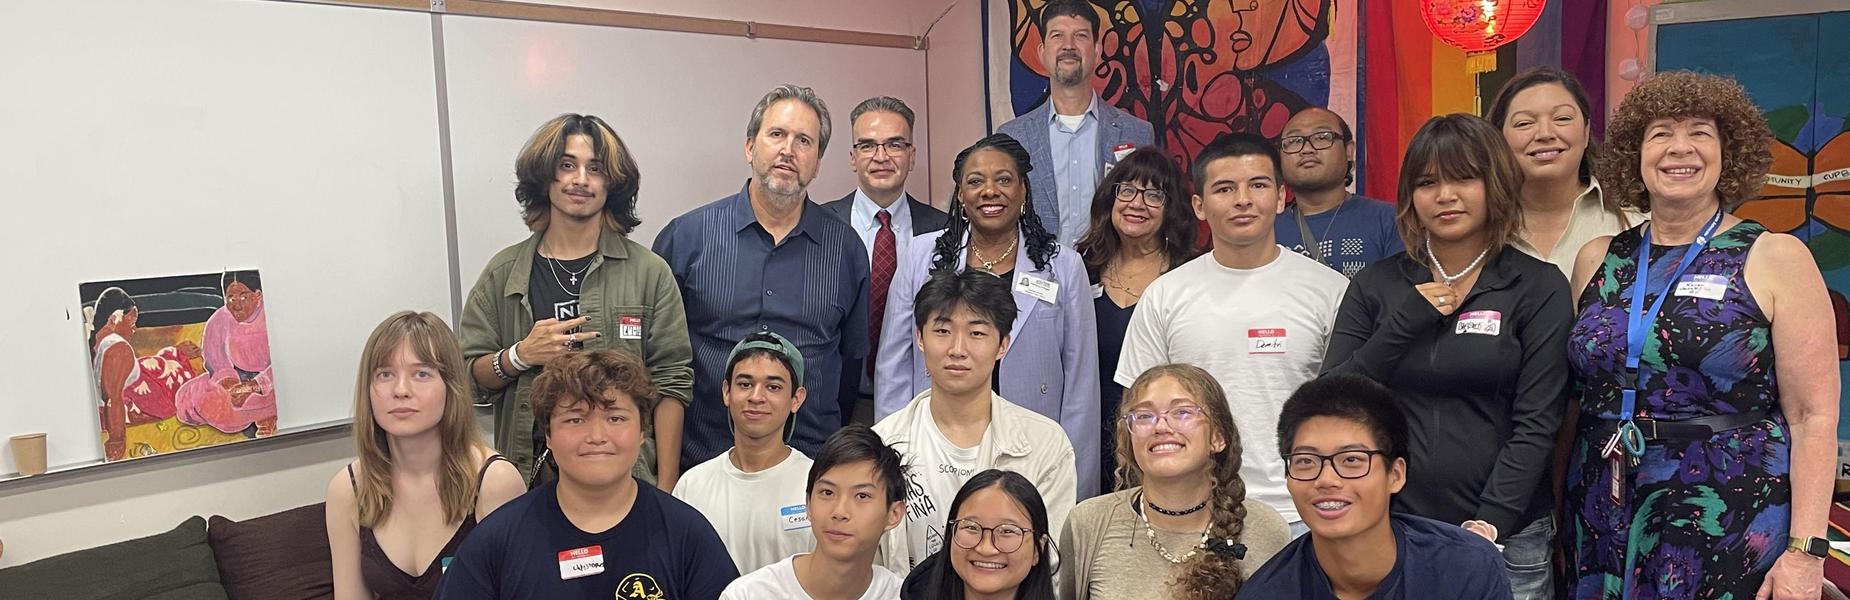
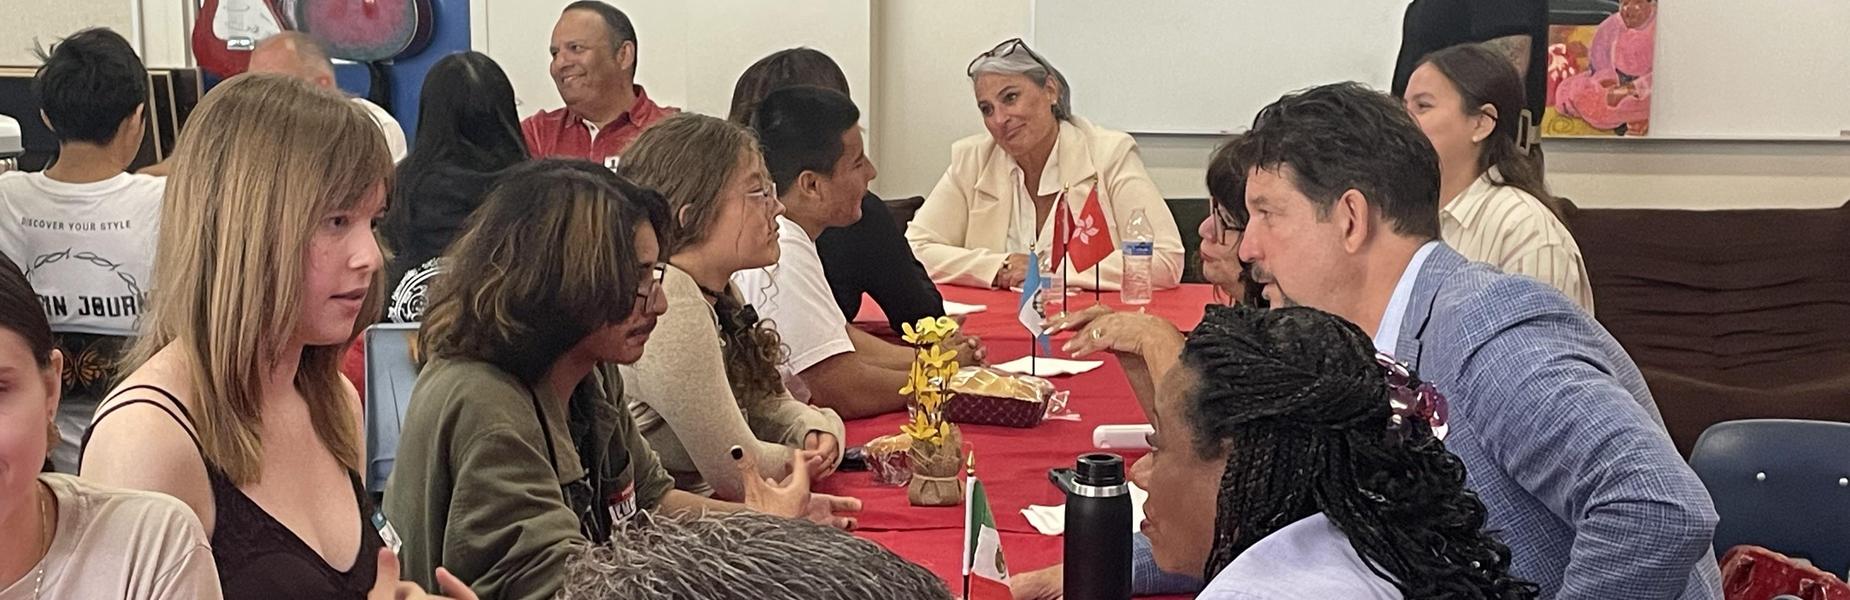
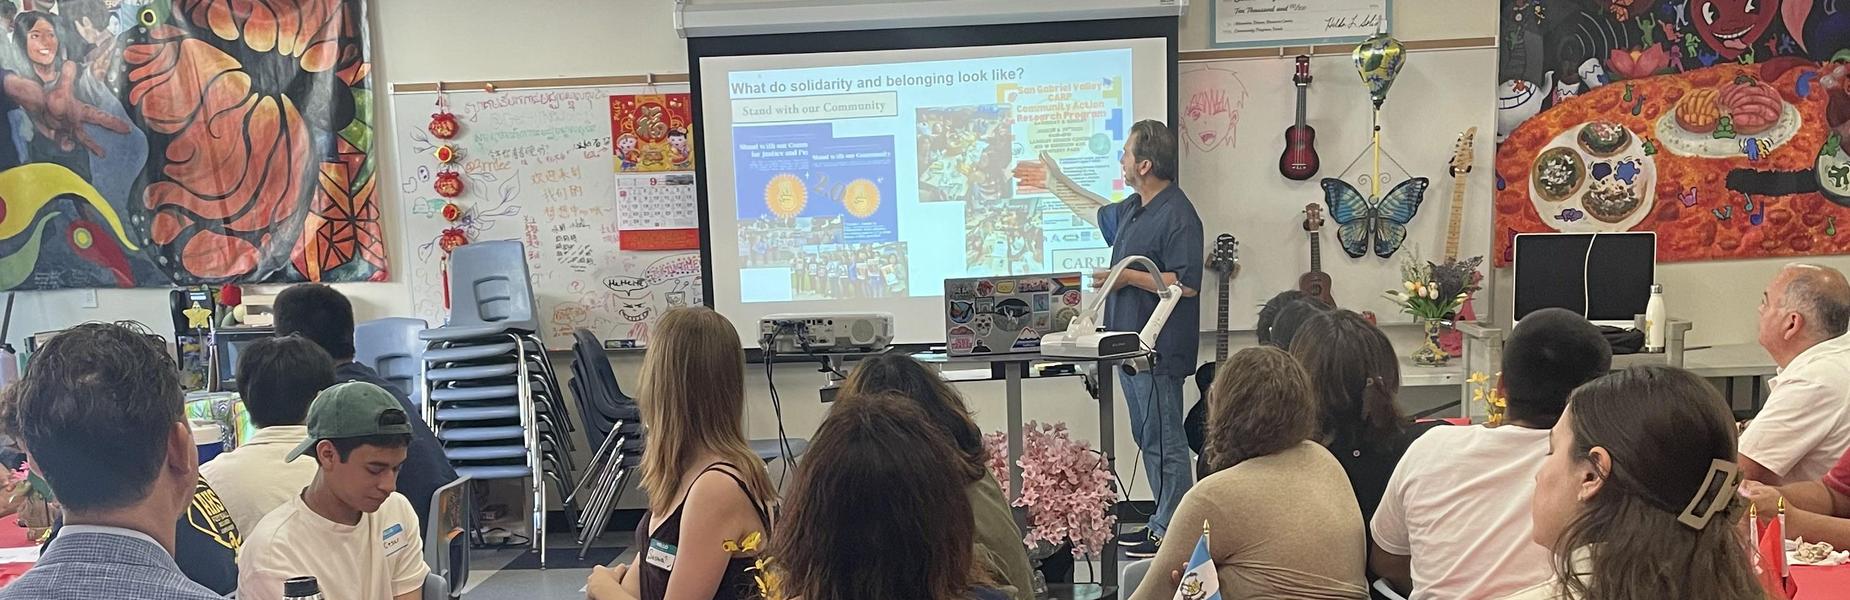
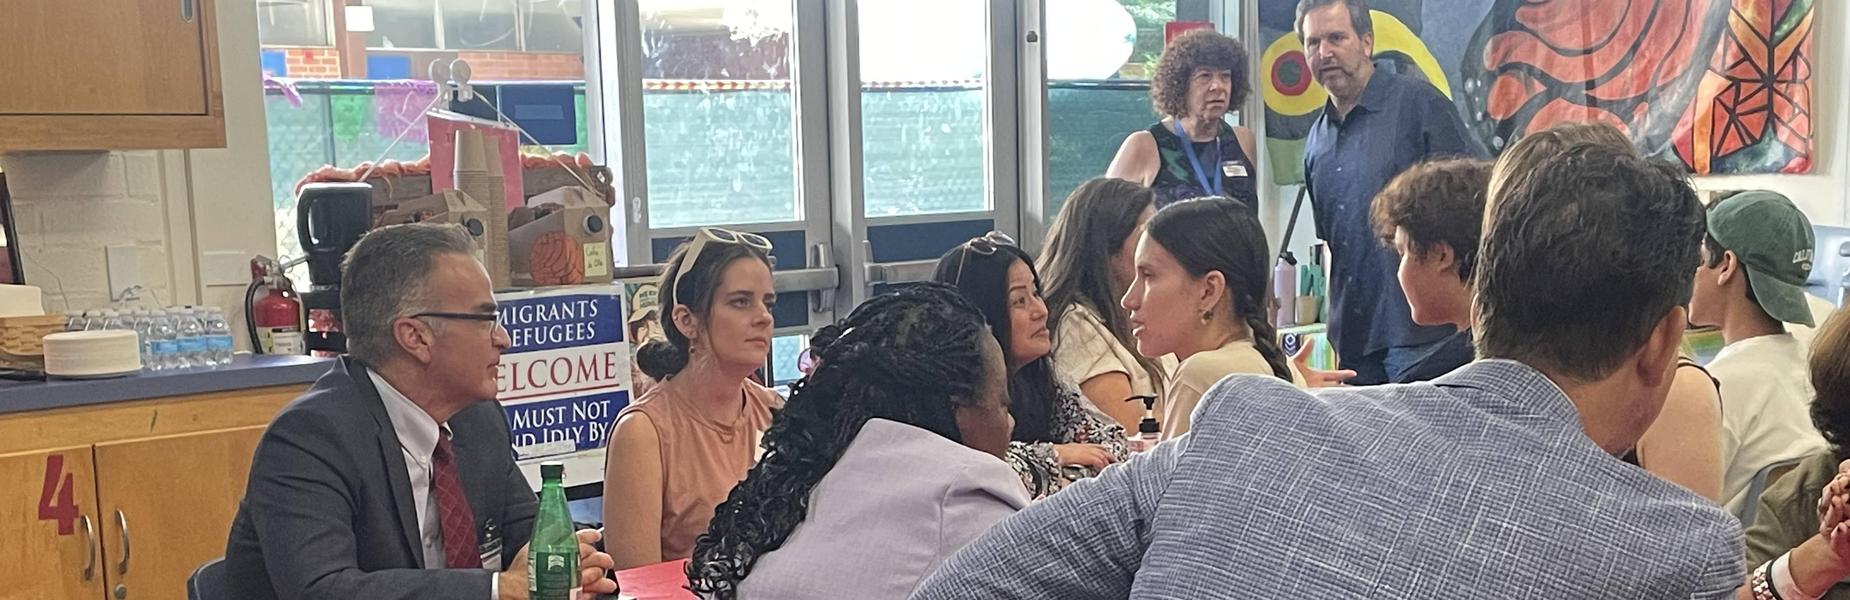
NEA/CTA Dream Center Visit

Our wonderful AHS Counseling Staff


We wonder if Grammarly should be used...


Alhambra High School, Main Street (circa 1905)
Alhambra High School, Main Street looking west
Science Building 1923
Alhambra High School, Typical Classroom (circa 1925)
Alhambra High School, Main Street (circa 1930s)
Alhambra High School, Main Street 1934
Alhambra High School, Main Street (circa 1940s)
A rare snow day (Jan. 1949?)
A rare snow day (Jan. 1949?)
AHS Class of Spring 1950
Alhambra HS 1953
Alhambra HS 1957
Alhambra High School 1957
AHS 1957
D Building at twilight
D Building
D Building at twilight
D Building at twilight
C Building
"On a clear day..."

by Lynn Huynh
By artist Kasa Lai